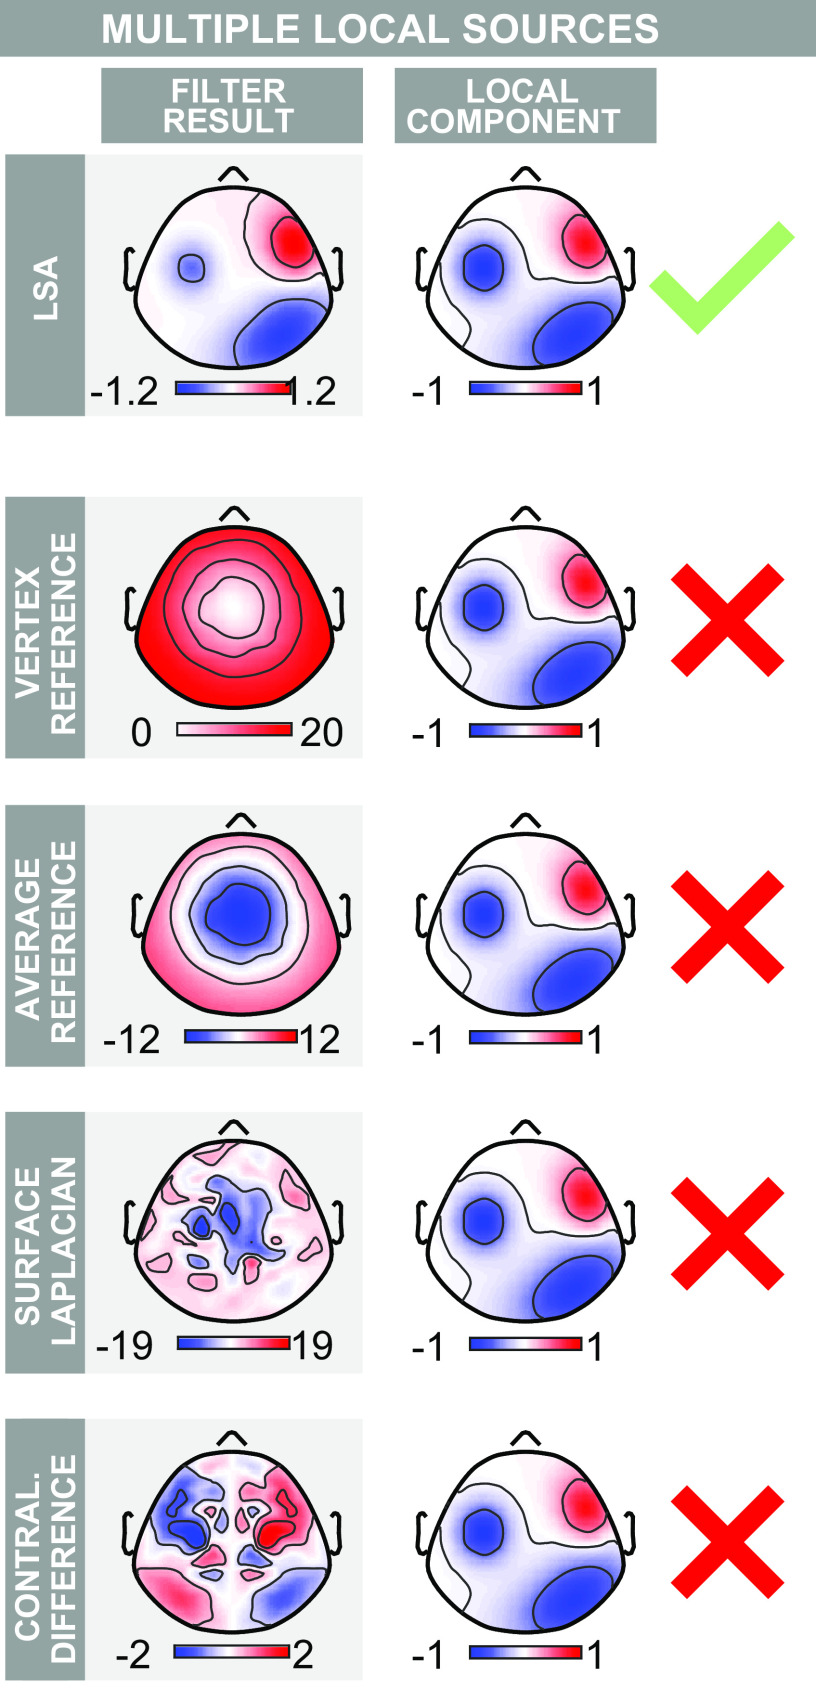
Figure 4.
Performance of local spatial analysis (LSA) on simulated event-related potential (ERP) data containing a central widespread component and multiple lateralized local components. Layout is as in Fig. 2 but two local components have been added. LSA successfully returns a scalp topography virtually identical to that of the multiple original local components. Commonly used stationary filters fail to highlight the local components. The contralateral difference merges two of the local sources, because it returns spurious components on opposite hemispheres. Color axes represent voltage (µV).

