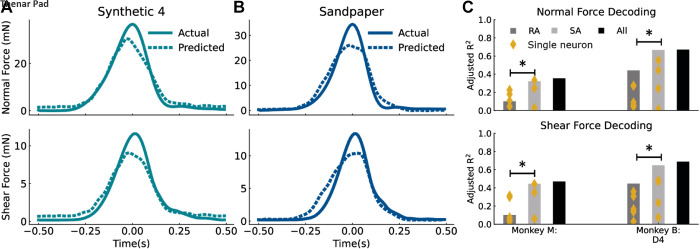
Figure 5.
Estimating forces from neural activity. Actual force traces compared with forces estimated using a linear model for synthetic 4 (A) and sandpaper from all neurons [five rapidly adapting (RA), four slowly adapting (SA)] in monkey B (B). C: estimates of normal (top) and shear (bottom) force from neural activity. Four estimations were performed, using different neural signals: individual neurons (yellow dots), all RA neurons, all SA neurons, and all neurons together. *Significantly different decoding performance, P < 0.05, Mann—Whitney U test.

