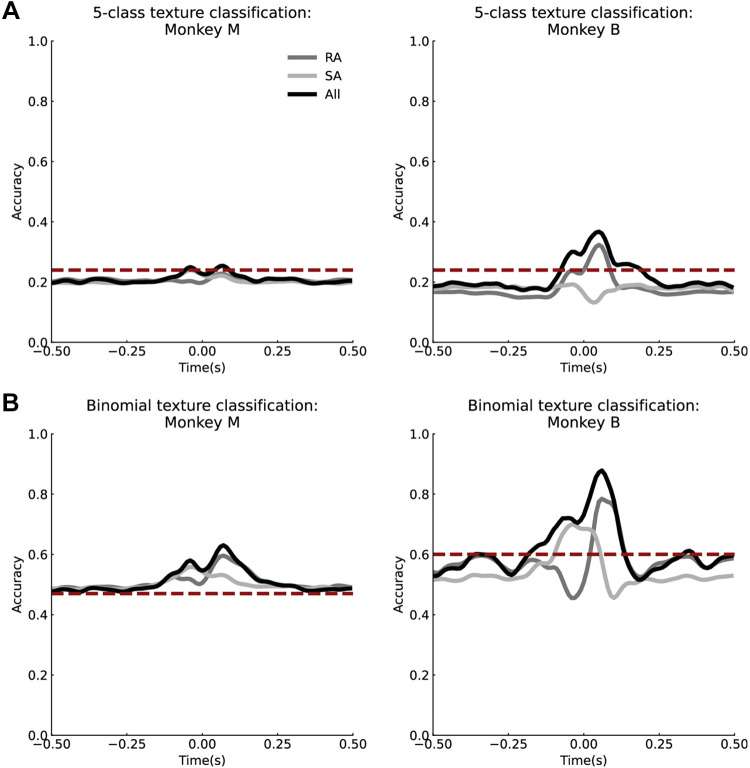
Figure 6.
Texture decoding from neural activity. A: average texture classification accuracy over time for rapidly adapting (RA), slowly adapting (SA), and all neurons across five textures for monkey M (left) and monkey B (right). All trials were used, and thus a wide range of contact forces. B: texture decoding for two textures that have similar normal and shear force profiles for monkey M (left) and monkey B (right). Time = 0 is the peak of the normal force. The dashed red lines represent the baseline texture classification accuracy using only the relationship between the shear and normal force.

