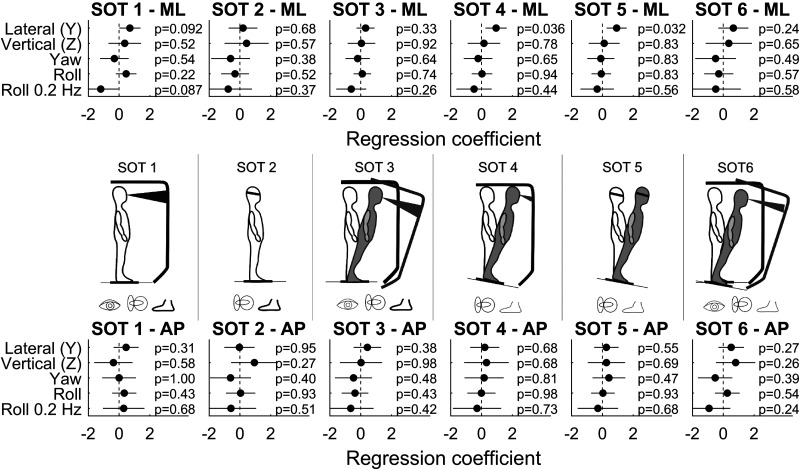
Figure 3.
Results of multiple variable linear regressions between postural sway and the vestibular threshold measures in study A, for each of the 6 sensory organizations (SOTs) and 2 directions [mediolateral (ML) and anterioposterior (AP)]. Each circle shows the estimated coefficient between the corresponding threshold measure and sway, with the 95% confidence intervals shown by black lines.

