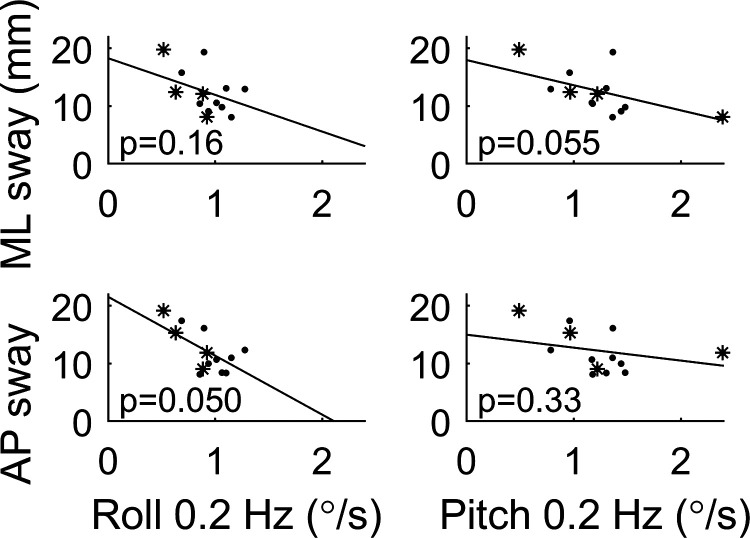
Figure 5.
Relationship between postural center-of-pressure (CoP) sway in condition 4 of the Romberg test and vestibular thresholds, in which subjects stand on foam with eyes closed. Each dot represents 1 subject in study B. Vestibular migraine (VM) subjects are shown as stars, with 1 subject missing because they did not complete condition 4. Partial slope lines show the results of a multiple variable linear regression between sway and the threshold for all subjects, with the corresponding P value provided. Normal subject results are in Fig. 6.

