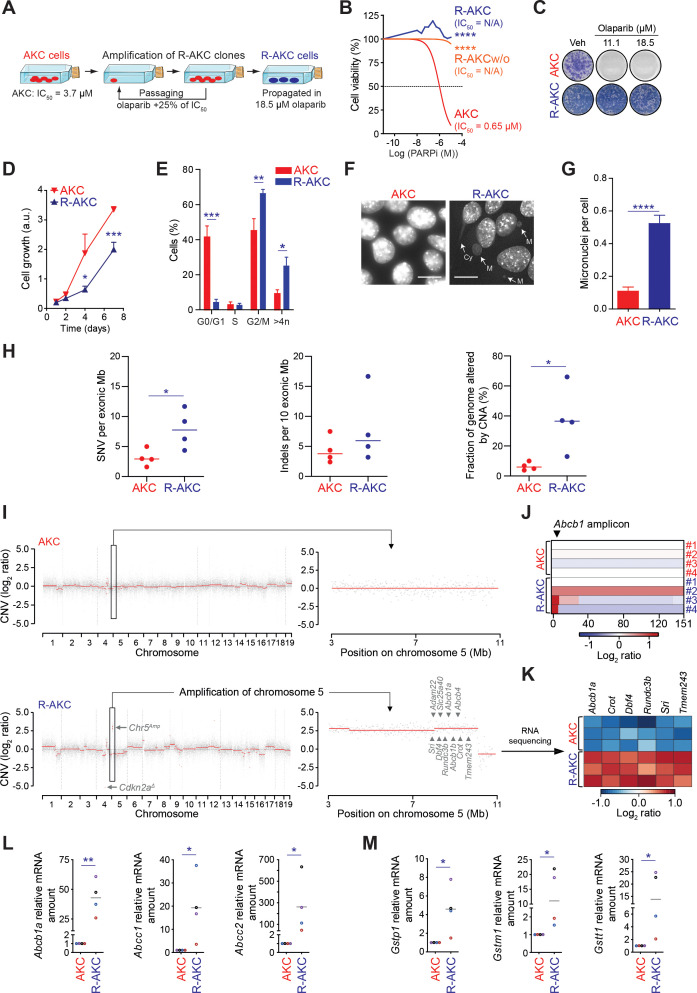
Figure 8.
PARP inhibitor resistance induces genomic instability and chromosomic rearrangements in ATM-deficient PDAC cells. (A) Schematic representation of PARPi-resistant Atmfl/fl; LSL-KrasG12D/+; Ptf1aCre/+ cells (R-AKC) generation. (B) Viability assay analysis of olaparib treatment (PARPi) in Atmfl/fl; LSL-KrasG12D/+; Ptf1aCre/+ (AKC), R-AKC and, R-AKC cells propagated without olaparib for 32 days (R-AKCw/o). (C) Colony formation assay on AKC and R-AKC cells treated with varying combinations of olaparib. (D) MTT assay-based cell growth of AKC and R-AKC cells (over the course of 7 days). (E) Cell cycle analysis by flow cytometry using DAPI DNA staining of AKC and R-AKC cells. (F) Direct fluorescence staining of DNA by DAPI (white) and (G) quantification of micronuclei in AKC and R-AKC cells. White arrows show micronuclei (M) and cytokinesis bridge (Cy). Scale bars represent 10 µm. (H) Whole exome sequencing-based evaluation of genomic alterations (SNV, single nucleotide variants; Indels, insertions/deletions; CNA, copy number alteration) in R-AKC versus AKC cell lines. (I) Whole exome sequencing-based copy number profiles for a parental AKC (upper panel) and respective R-AKC (lower panel) cell lines. (J) Whole exome sequencing-based copy number profile of the Abcb1 amplicon region for parental AKC and respective R-AKC cell lines. (K) RNA sequencing-based gene expression of six genes located at the Abcb1 amplicon, in R-AKC versus AKC cells. Data show log2 ratios obtained from three RNA sequencing technical replicates performed on the parental AKC and R-AKC cell lines used in (I). (L) qRT-PCR analysis of drug efflux transporters and (M) xenobiotic detoxification enzymes gene expression in AKC and R-AKC cells.

