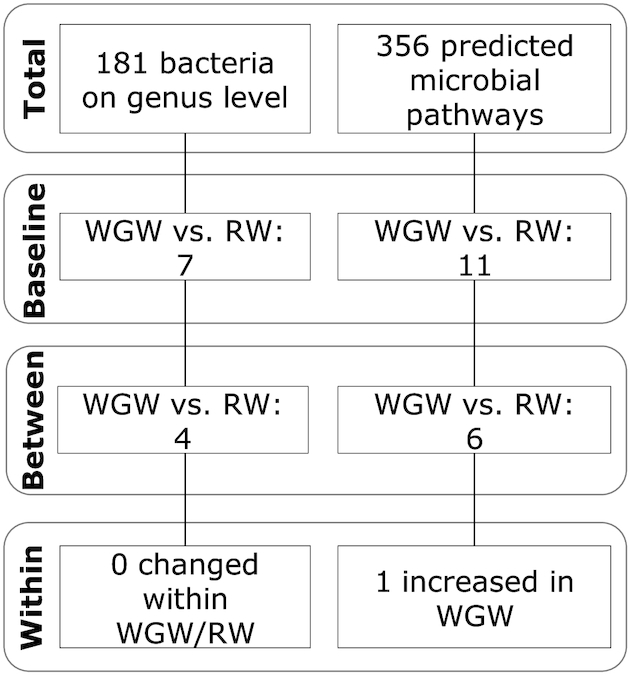
FIGURE 1.

Significantly different fecal bacterial taxa and bacterial pathways at baseline and after 12-wk of an RW or WGW intervention in middle-aged overweight and obese adults. The flow diagram shows the number of bacterial taxa at the genus level and the predicted pathways for which the change in relative abundance was significantly different among interventions. RW, refined wheat; WGW, whole grain wheat.
