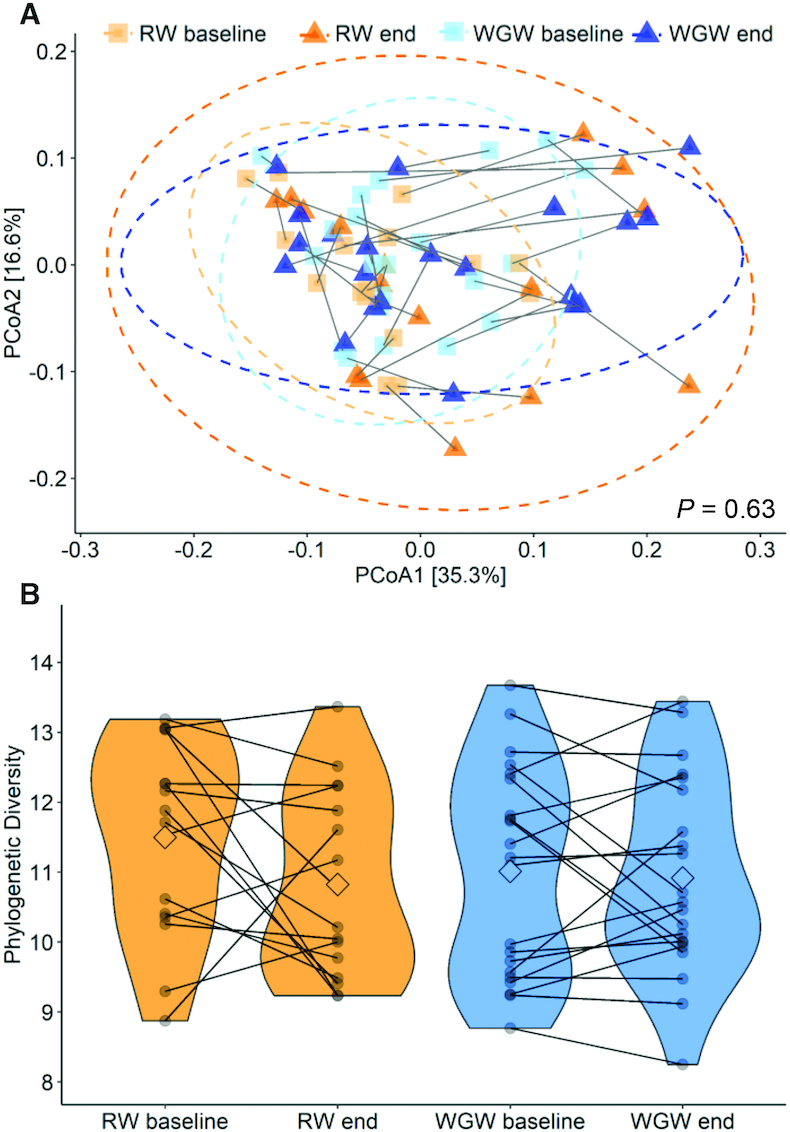
FIGURE 2.

The effect of 12 wk of an RW or WGW intervention on the fecal microbiota diversity in middle-aged overweight and obese adults. (A) PCoA plot using weighted UniFrac dissimilarity to visualize the overall microbiota community variation. Color and shape highlight the intervention groups before or after the intervention. The lines connect the within-person samples over time; 95% CIs are plotted. (B) Microbial diversity as assessed using Faith phylogenetic diversity at baseline and after the 12-wk intervention (end). Individual paired samples are connected by a line. The width of the colored shapes indicates the sample density, the squared shape inside indicates the group mean. PCoA, principal coordinate analysis; RW, refined wheat; WGW, whole grain wheat.
