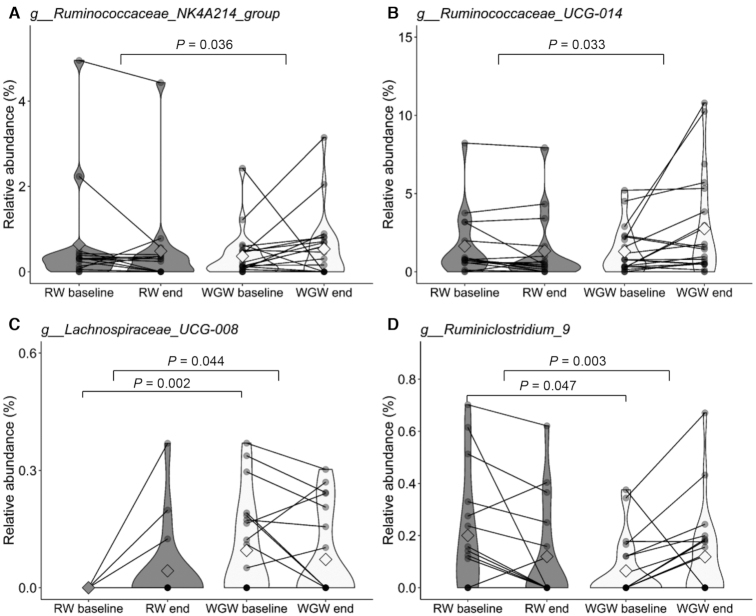
FIGURE 3.
Fecal bacterial taxa at the genus level at baseline and after the 12-wk RW or WGW intervention (end) that were found to be significantly different between the groups in middle-aged overweight and obese adults. The relative abundances of (A) Ruminococcaceae_NK4A214_group; (B) Ruminococcaceae_UCG-014; (C) Lachnospiraceae_UCG-008; and (D) Ruminiclostridium_9 are shown. Data are presented as group mean (the squared shape), n = 16 (RW) or n = 21 (WGW), and the width of the colored shapes indicates the sample density. Individual paired samples are connected by a line. RW, refined wheat; WGW, whole grain wheat.

