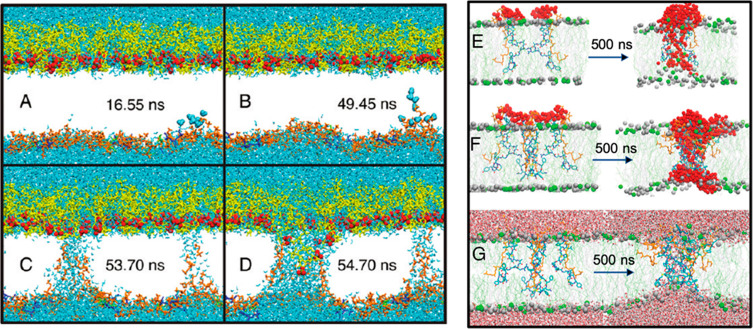
Figure 6.
Pore formation by electroporation (left panel) and unbiased AA MD (right panel). (A–D) Sequence of events in the electroporation of the E. coli outer membrane with an electric field of 0.4 V/nm applied. Phosphatidylethanolamine lipids are shown in orange, PGN layer in green, 2,3-diphosphoglycerate in blue, and LPS in yellow. Lipid tails have been omitted for clarity. Reprinted from ref (18). Copyright 2011 American Chemical Society. (E,F) Assemblies of two and four complexes of MU1140–lipid II in a bacterial membrane at the beginning and end of the 500 ns simulations, respectively. Reprinted with permission from ref (23). Copyright 2019 Royal Society of Chemistry. MU1140 chains are colored by residue types; lipid II chains are highlighted in yellow, and the water molecules are highlighted as red spheres. Phosphorus atoms of POPE are shown as green spheres and POPG phosphorus atoms as gray spheres. (G) Same as (F) but showing the water molecules above and below the lipid layers.

