
Figure 7.
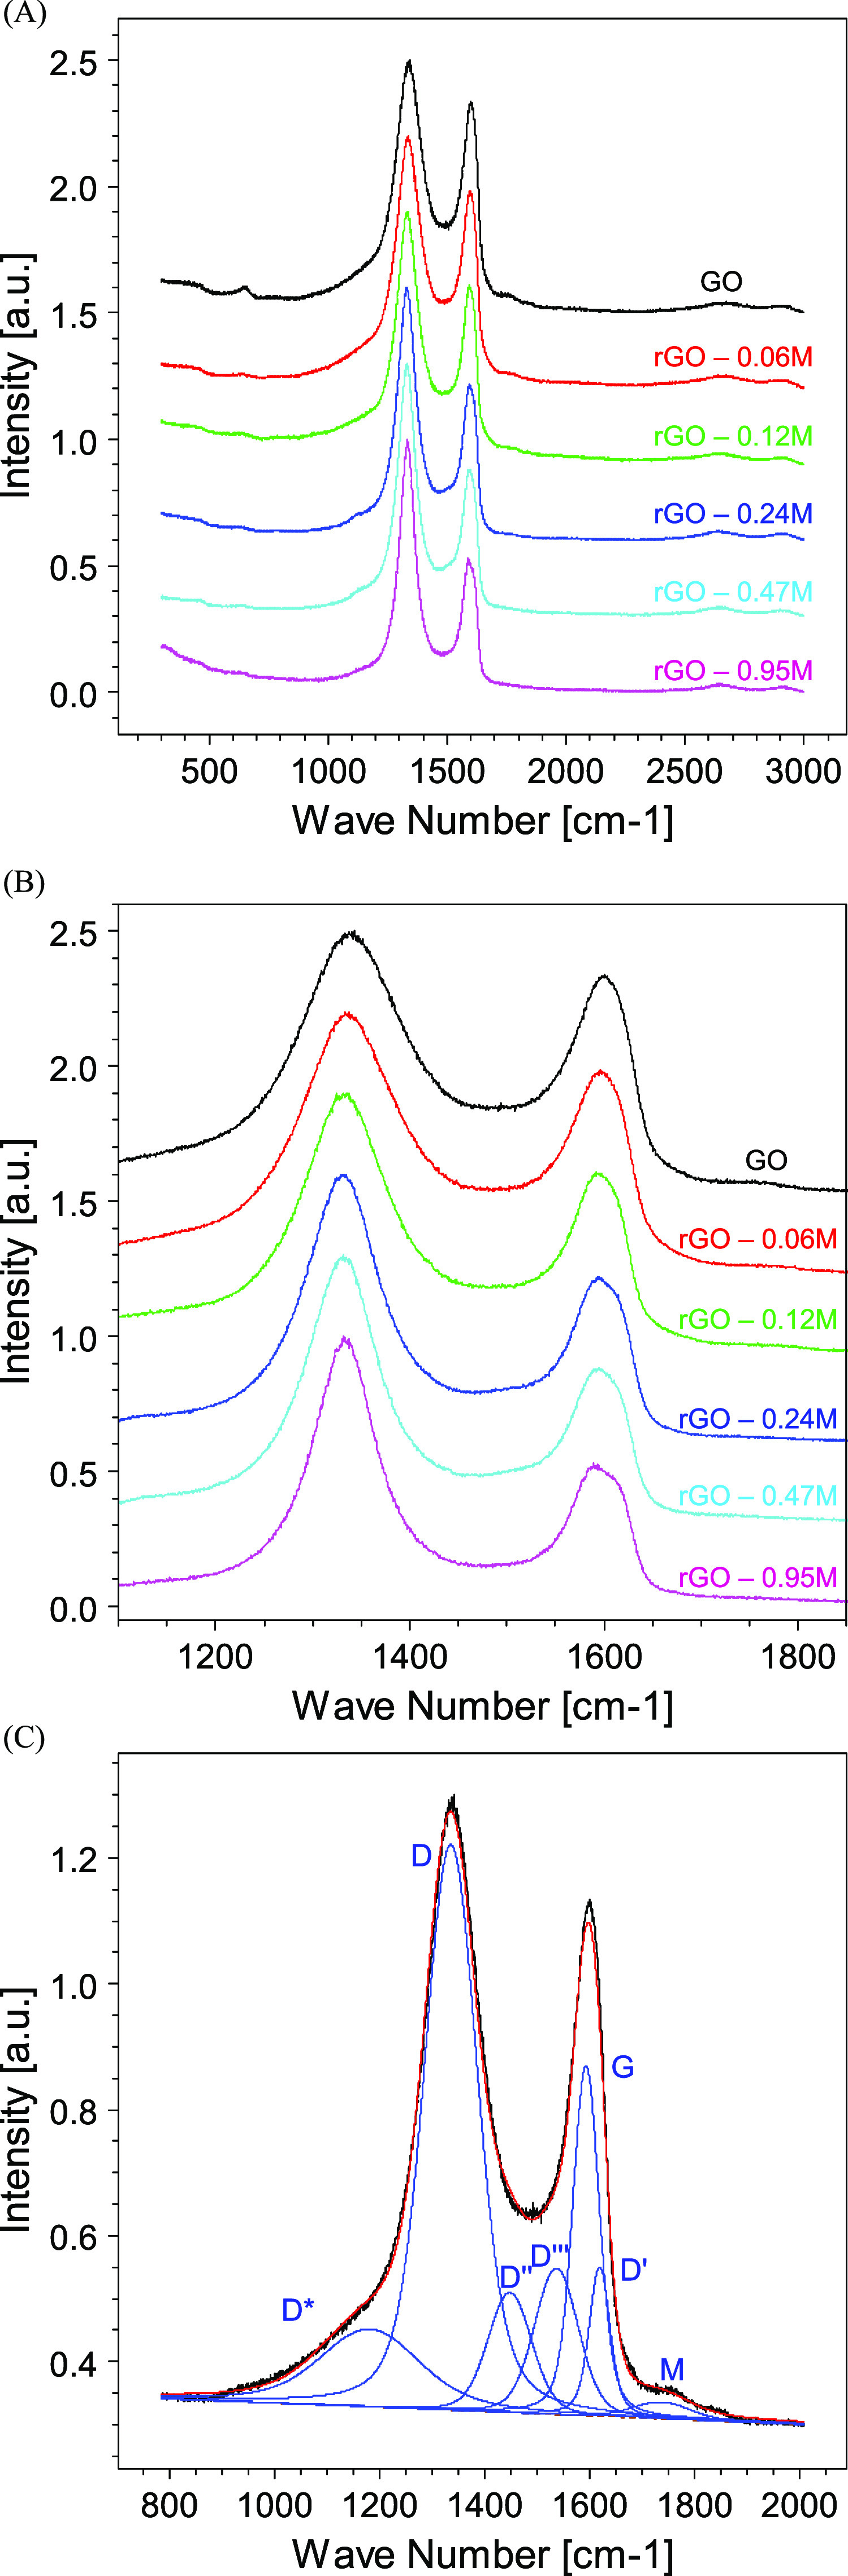
(A) Raman spectra of GO and rGO reduced with different HI concentrations. (B) Zoomed view of the D and G band evolution as a function of the HI concentration, (C) example of the Raman band fitting together with the fit component assignment.