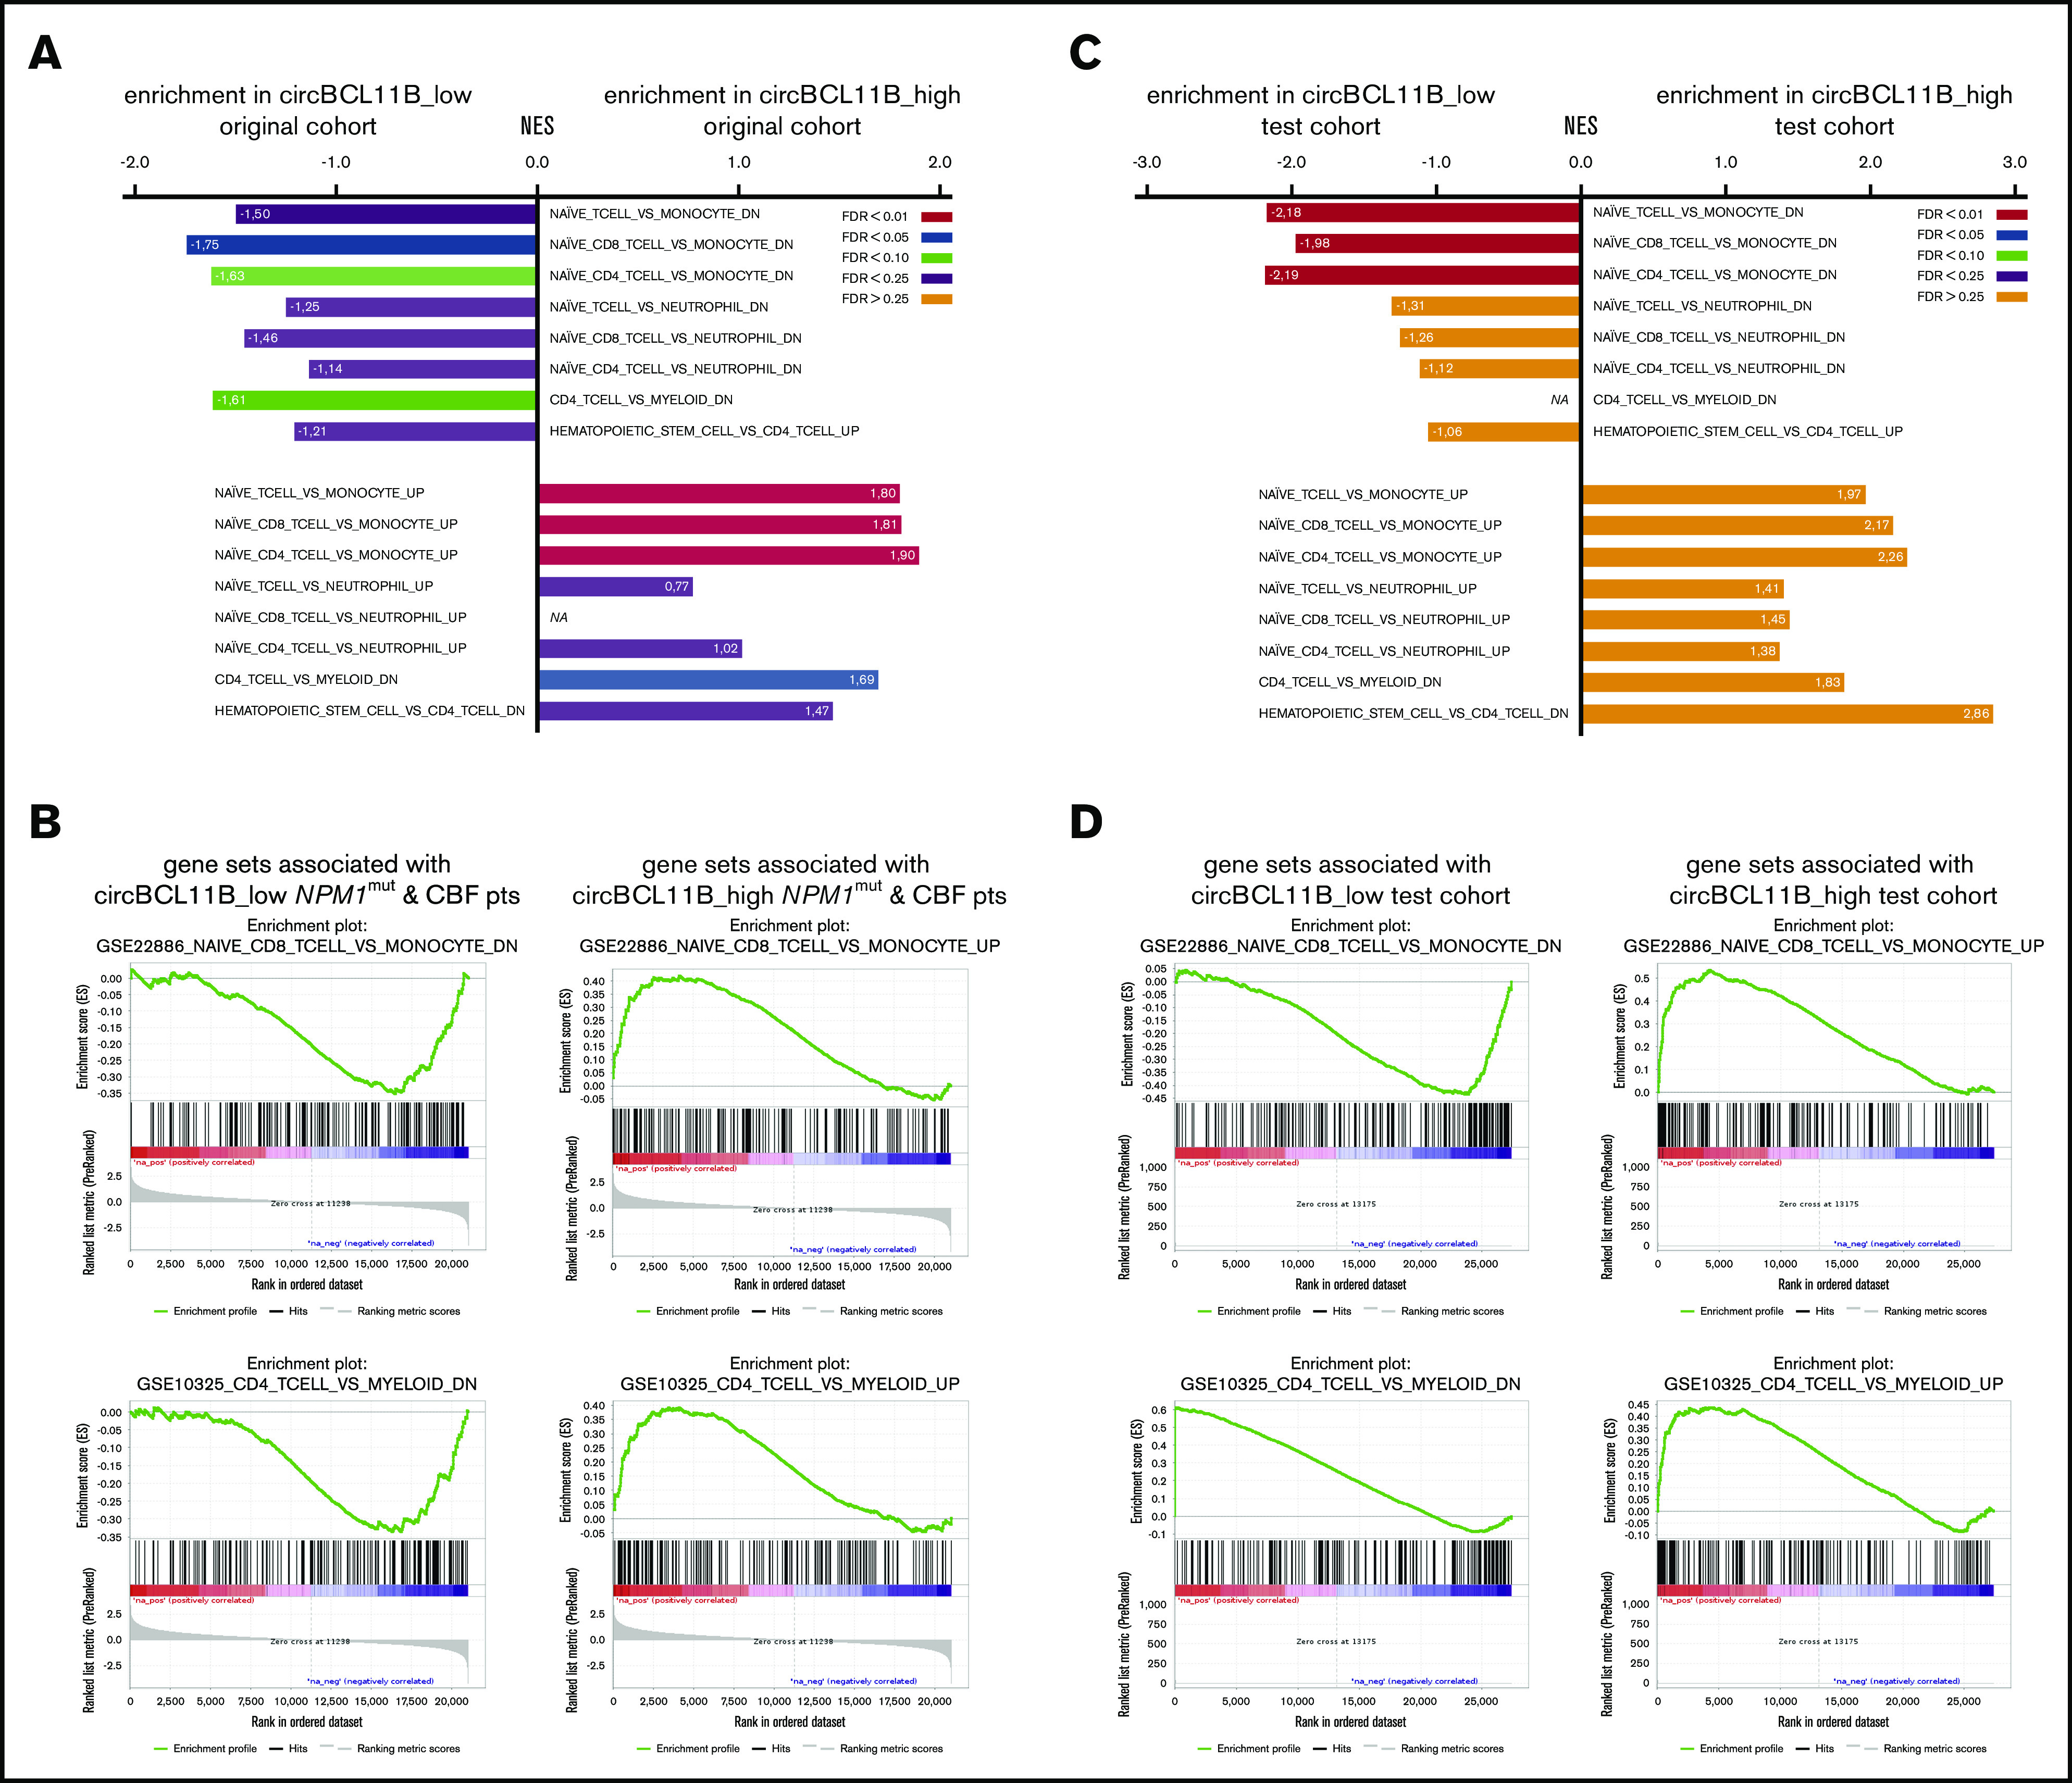
Figure 4.

CircBCL11B expression is associated with a T-cell–like gene expression signature. Gene set enrichment analysis of genes differentially expressed between circBCL11B_high and circBCL11B_low AML patients. (A-B) Results of the original cohort (29 patients included in this analysis; with n = 12 circBCL11B_high and n = 17 circBCL11B_low). (C-D) Results of the independent test cohort (of 332 patients, 19 were assigned to circBCL11B_high, and 155 were assigned to circBCL11B_low). In panels A and C, bars show the normalized enrichment score (NES) of gene sets enriched in circBCL11B_low patients (left, negative NES) and in circBCL11B_high patients (right, positive NES). FDR is color coded as indicated. (B,D) Exemplary GSEA plots of gene sets enriched in circBCL11B_low (left panels) and in circBCL11B_high patients (right panels).
