
Figure 1.
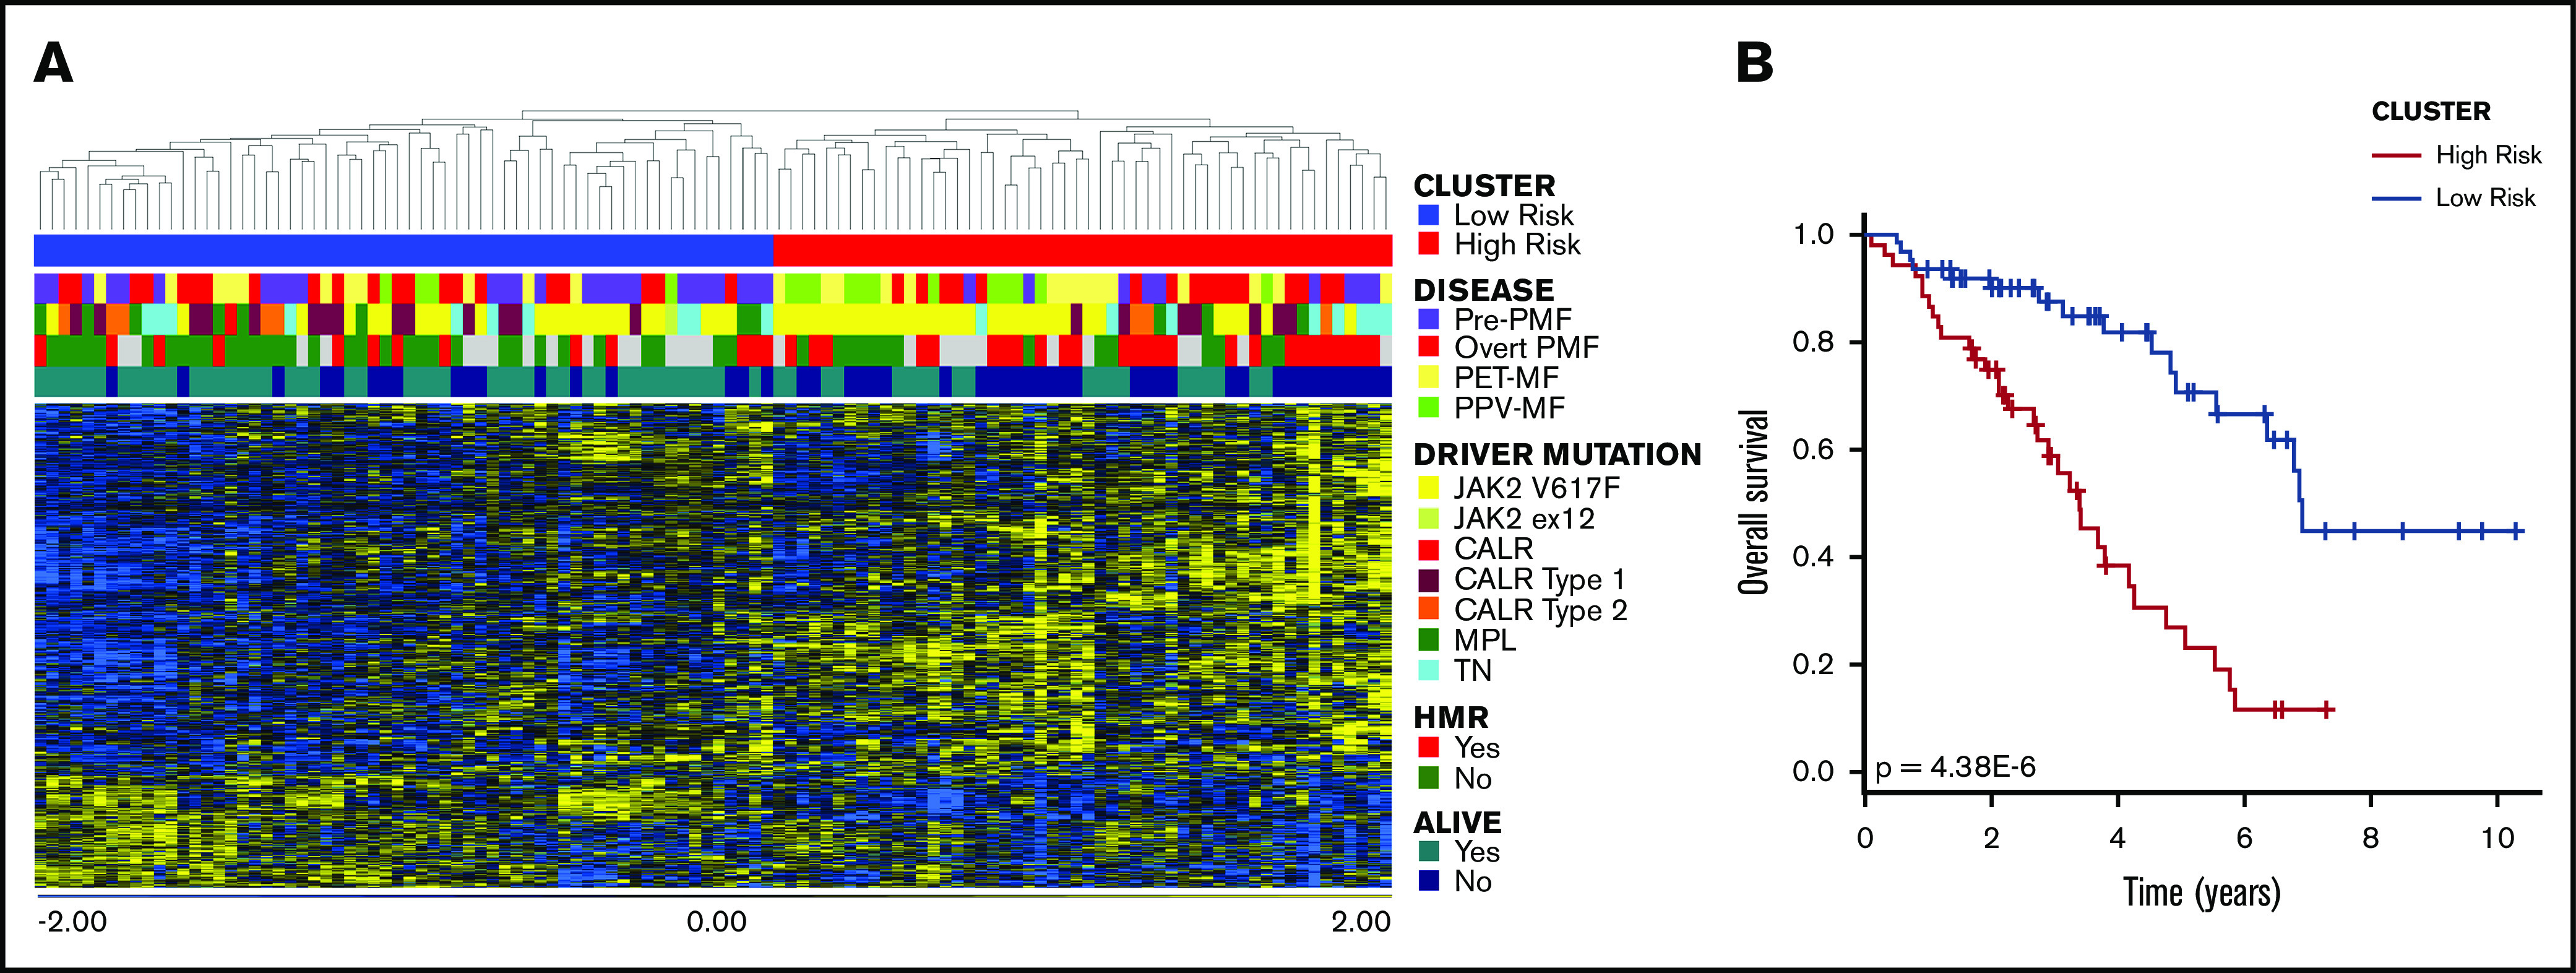
Cox-regression analysis. (A) Hierarchical clustering of samples according to the expression of 832 probesets that correlated with OS. The dataset was divided into 2 clusters. (B) The red cluster (on the right in the heatmap) displayed significantly inferior survival compared with the other one, as demonstrated by the result of log-rank test. Therefore, we defined the blue group as low-risk, whereas the red one was named high-risk.