
Figure 3.
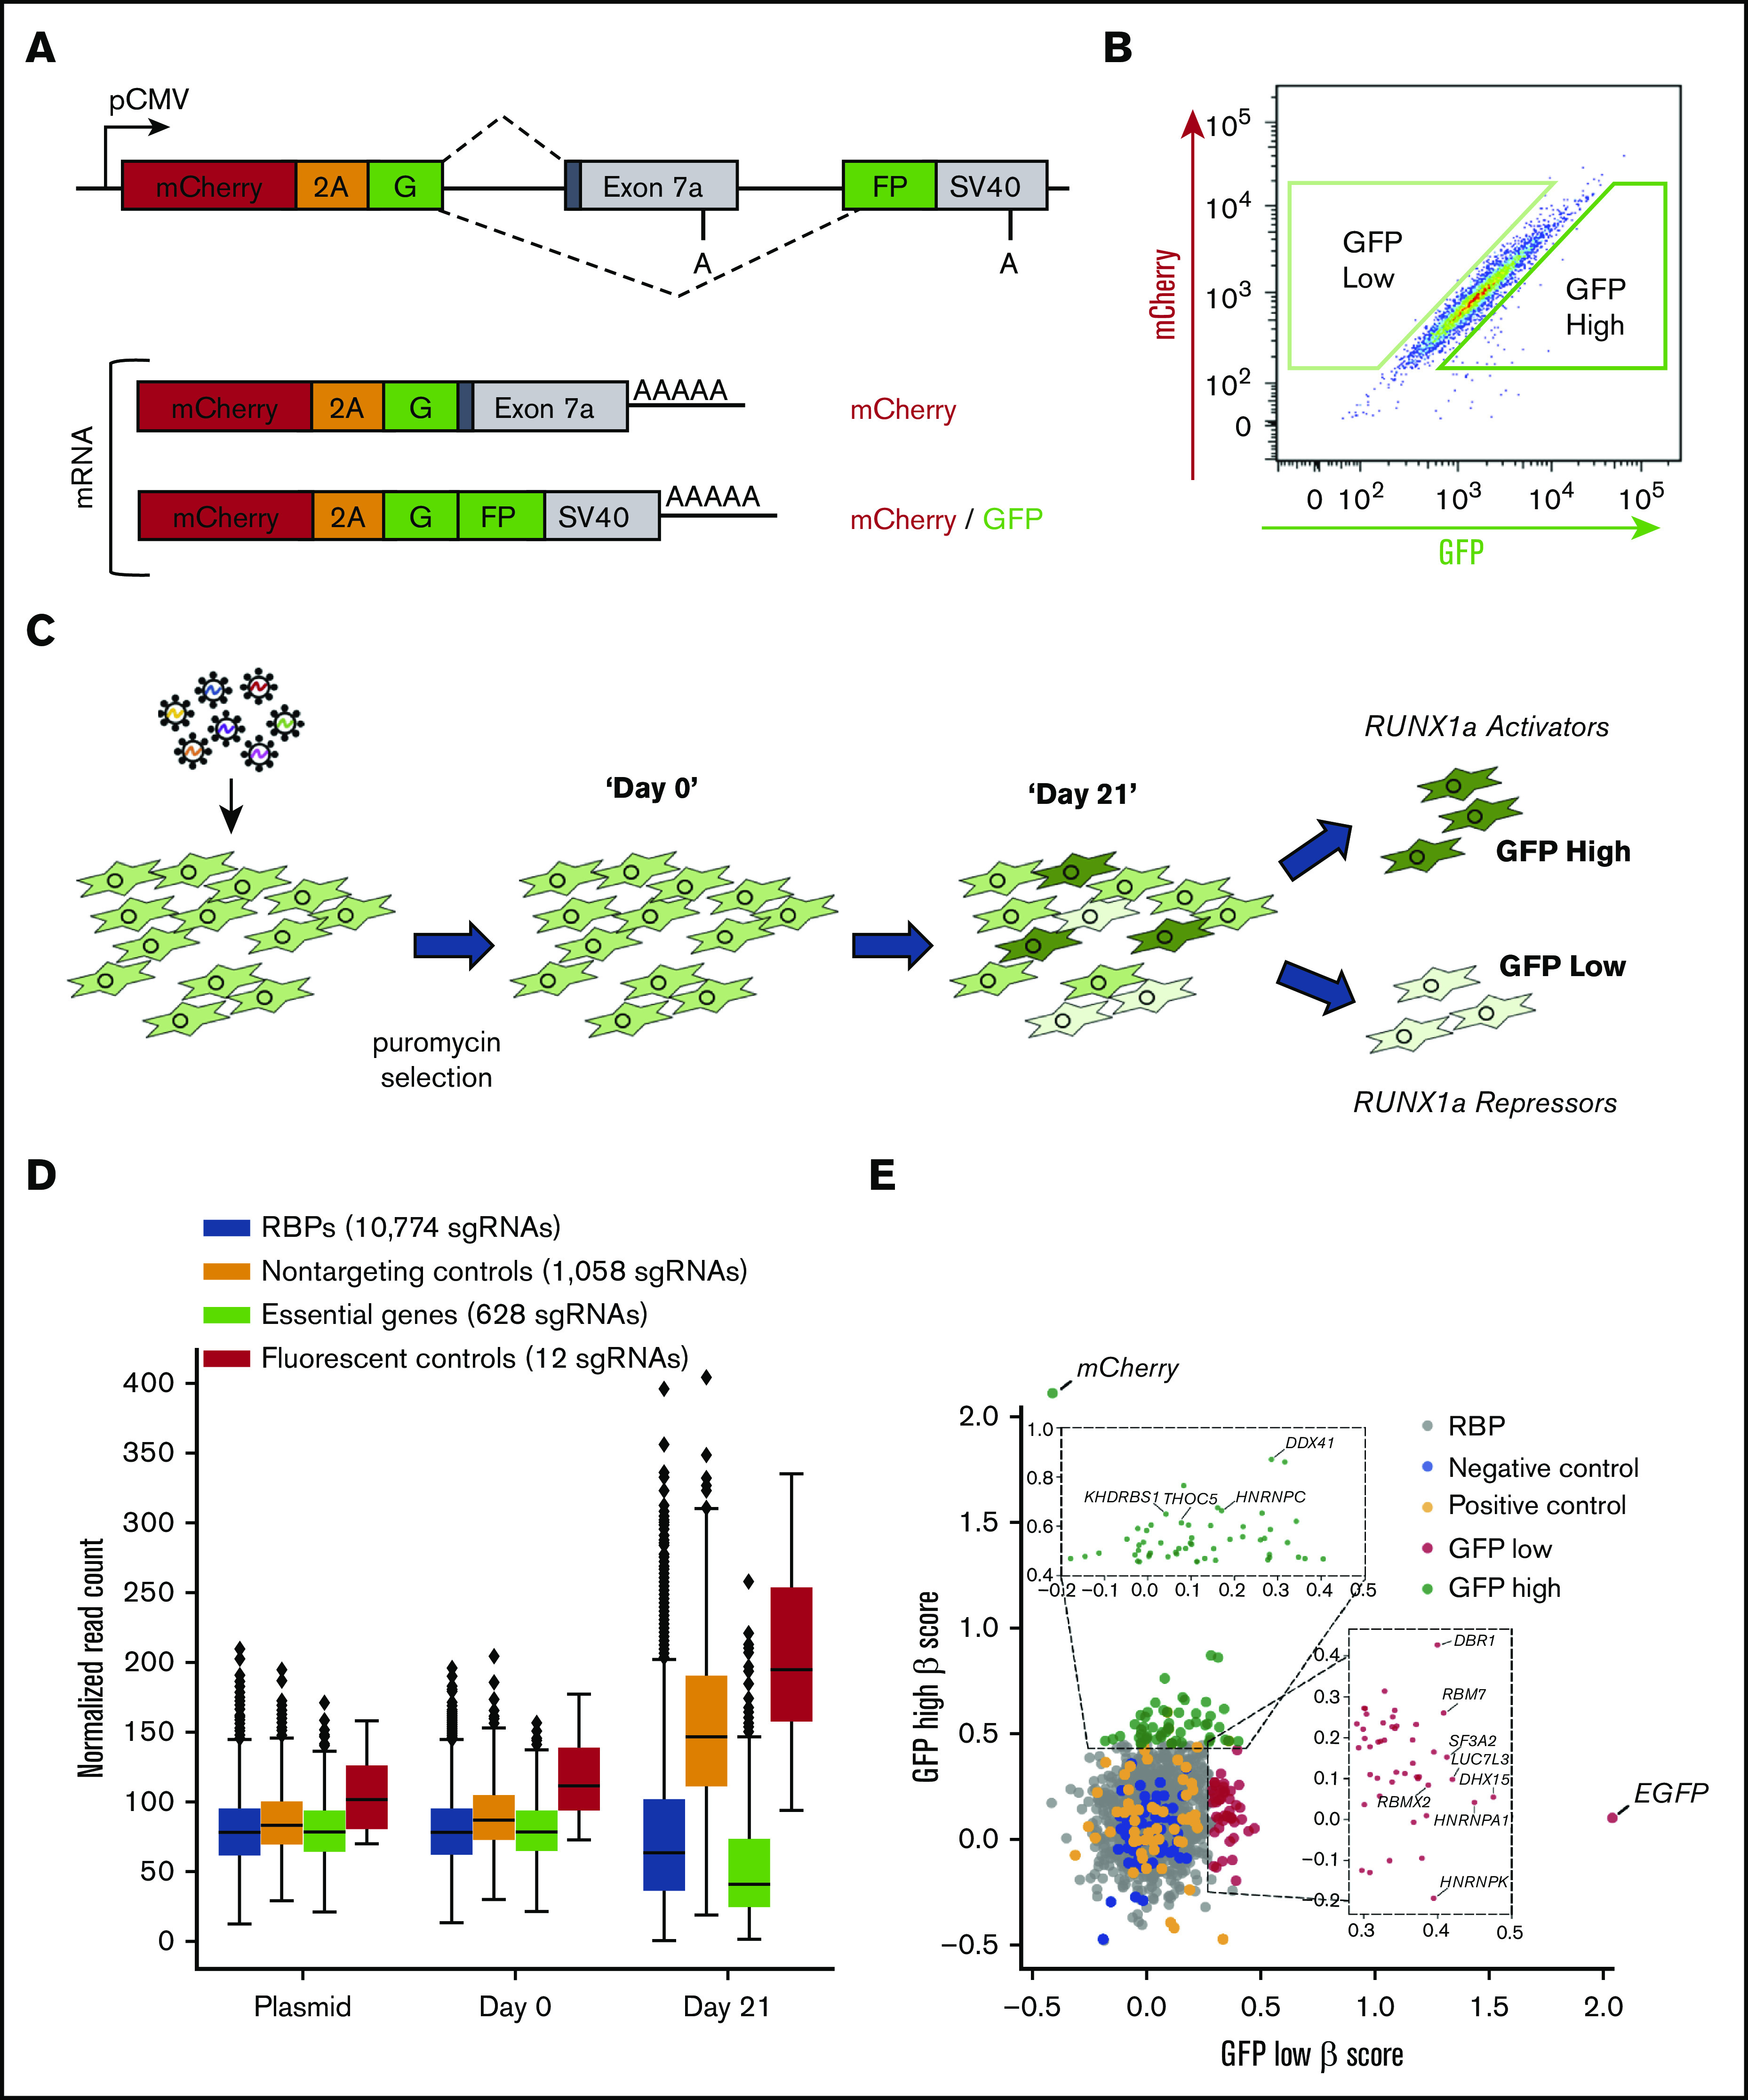
A CRISPR RBP screen reveals regulators of RUNX1a isoform formation. (A) Schematic of the bicistronic dual fluorescent minigene reporter used for the CRISPR screen. The RUNX1 exon 7a minigene reporter was modified by subcloning mCherry and a P2A peptide upstream of the first GFP exon. Poly(A) sites are shown. (B) Representative flow cytometry plot of the stable clonal MDS-L cell line containing the dual fluorescent reporter from panel A. Boxed regions represent the gating of GFP high and low cell populations that were sorted at the end point of the CRISPR screen. (C) Schematic diagram of the CRISPR screen. MDS-L cells stably expressing the dual fluorescent RUNX1 exon 7a minigene construct were infected with lentiviral particles containing the RBP sgRNA library. Bulk cell populations were collected at day 0 and day 21. GFP high and low cells were sorted as depicted in panel B on day 21. (D) Box and whisker plots depicting sgRNA representation in the indicated cell populations and the plasmid library used for lentiviral production. Comparing plasmid vs day 0 using a 2-sided Student t test, all sgRNA populations are insignificant with the exception of essential sgRNAs (0.001526493), which were modestly depleted during the 72 hours of puromycin selection between transduction and our day 0 time point. Comparing day 0 with day 21, all sgRNA populations are significant. P < .001 for all comparisons with the exception of fluorescent controls (P < .01). (E) Plot depicting the β -scores of sgRNA enrichment in GFP high and low populations. The insets show all significantly enriched RBPs for both cell populations (P < .05). Splicing-related RBPs with P < .01 that were included in the secondary validation are labeled. Two sgRNAs targeting mCherry and 3 targeting EGFP were present in the sgRNA library and served as the positive controls for enrichment in the sorted GFP high and low cell populations, respectively. These controls were most significantly enriched in their respective populations and are labeled in the plot.