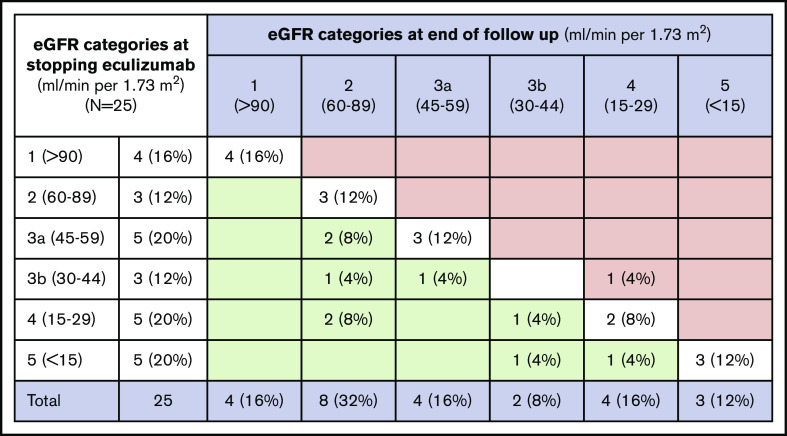
Figure 4.
Change in eGFR categories from date of stopping eculizumab until end of follow-up. Data from 25 patients that discontinued eculizumab presented as n (%). eGFR categories are shown in milliliters per minute per 1.73 m2. Green cells represent improvement from baseline to day 183, red cells represent worsening, and white cells represent no change.

