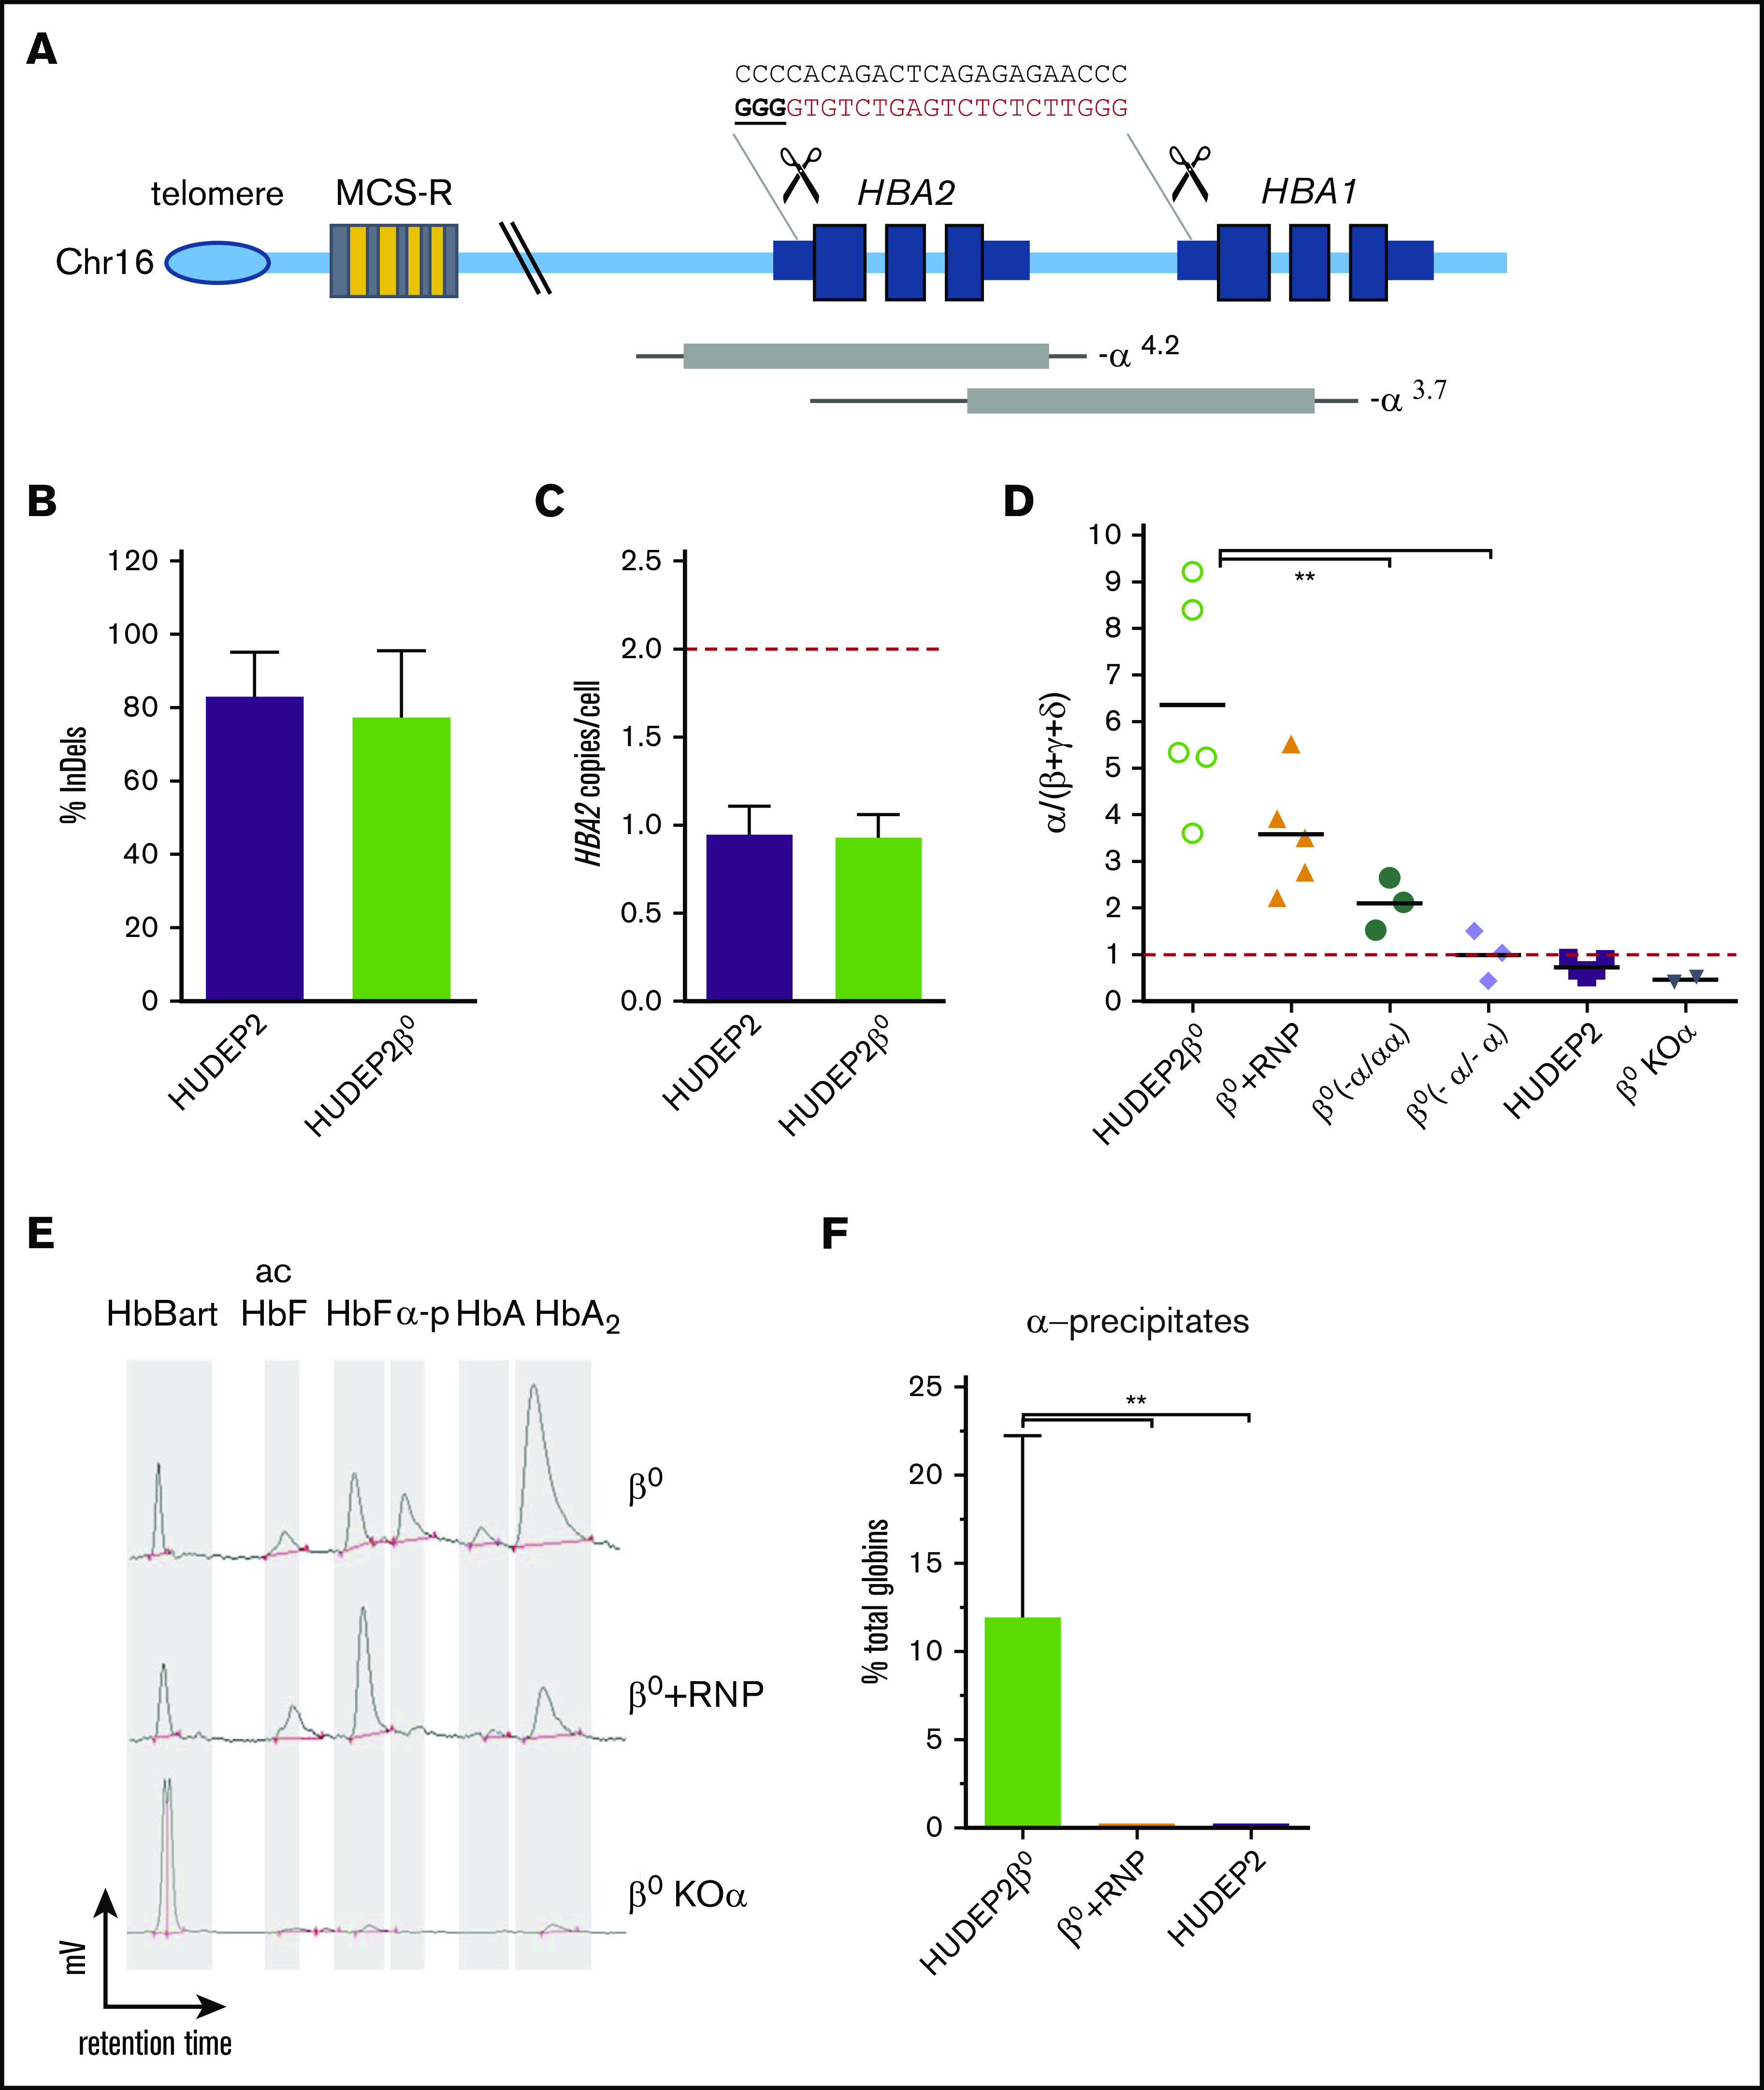
Figure 1.

Deletion of HBA2 reduces α-globin precipitates in HUDEP-2 β0cells. (A) Schematic representation of the α-globin locus. HBA1 and HBA2 genes are located in the subtelomeric region of chromosome (Chr) 16. Expression is regulated by 4 erythroid-specific enhancers (multispecies conserved elements [MCS-R]) located 10 to 50 kb upstream. Common occurring deletions are shown as gray bars and thin lines indicate regions of uncertainty of the breakpoints (adapted from Harteveld and Higgs98). gRNA cutting sites are indicated as scissors. gRNA nucleotide sequence is indicated on top (in bold/underlined the protospacer adjacent motif sequence). (B) Editing efficiency in HUDEP-2 cells is expressed as percentage of modified HBA alleles. Bars represent mean ± SD (n = 3). (C) HBA2 copies in edited cells in panel B. Red dashed line indicates the number of expected HBA2 alleles in normal cells. (D) Reverse transcription-qPCR quantification of α/β-like globin mRNA ratios in HUDEP-2 β0 (n = 3-5) and in single-cell clones with monoallelic (α-/αα; n = 3) or biallelic (α-/α-; n = 3) HBA2 deletions. β0 + RNP = HUDEP2 β0 bulk population edited with gRNA HBA15/Cas9. β0 KOα = HUDEP2 β0 bulk population edited with gRNA HBB/Cas9 to induce α-globin KO. Red dashed line indicates the physiological α/β-like ratio of 1. Bars represent mean ± SD (**P < .01, ANOVA, Tukey test). (E) Representative HPLC chromatograms of globin tetramer analysis in edited HUDEP-2 β0. γ4, Hb Bart; acHbF, acetylated fetal hemoglobin; HbF, fetal hemoglobin (α2γ2); α-p, α-precipitates; HbA, adult hemoglobin (α2β2). (F) Quantification of α-precipitates. Every tetramer is reported as percent of total hemoglobins; bars show mean ± SD (n = 3; **P < .01; ANOVA, Tukey test).
