Figure 3.

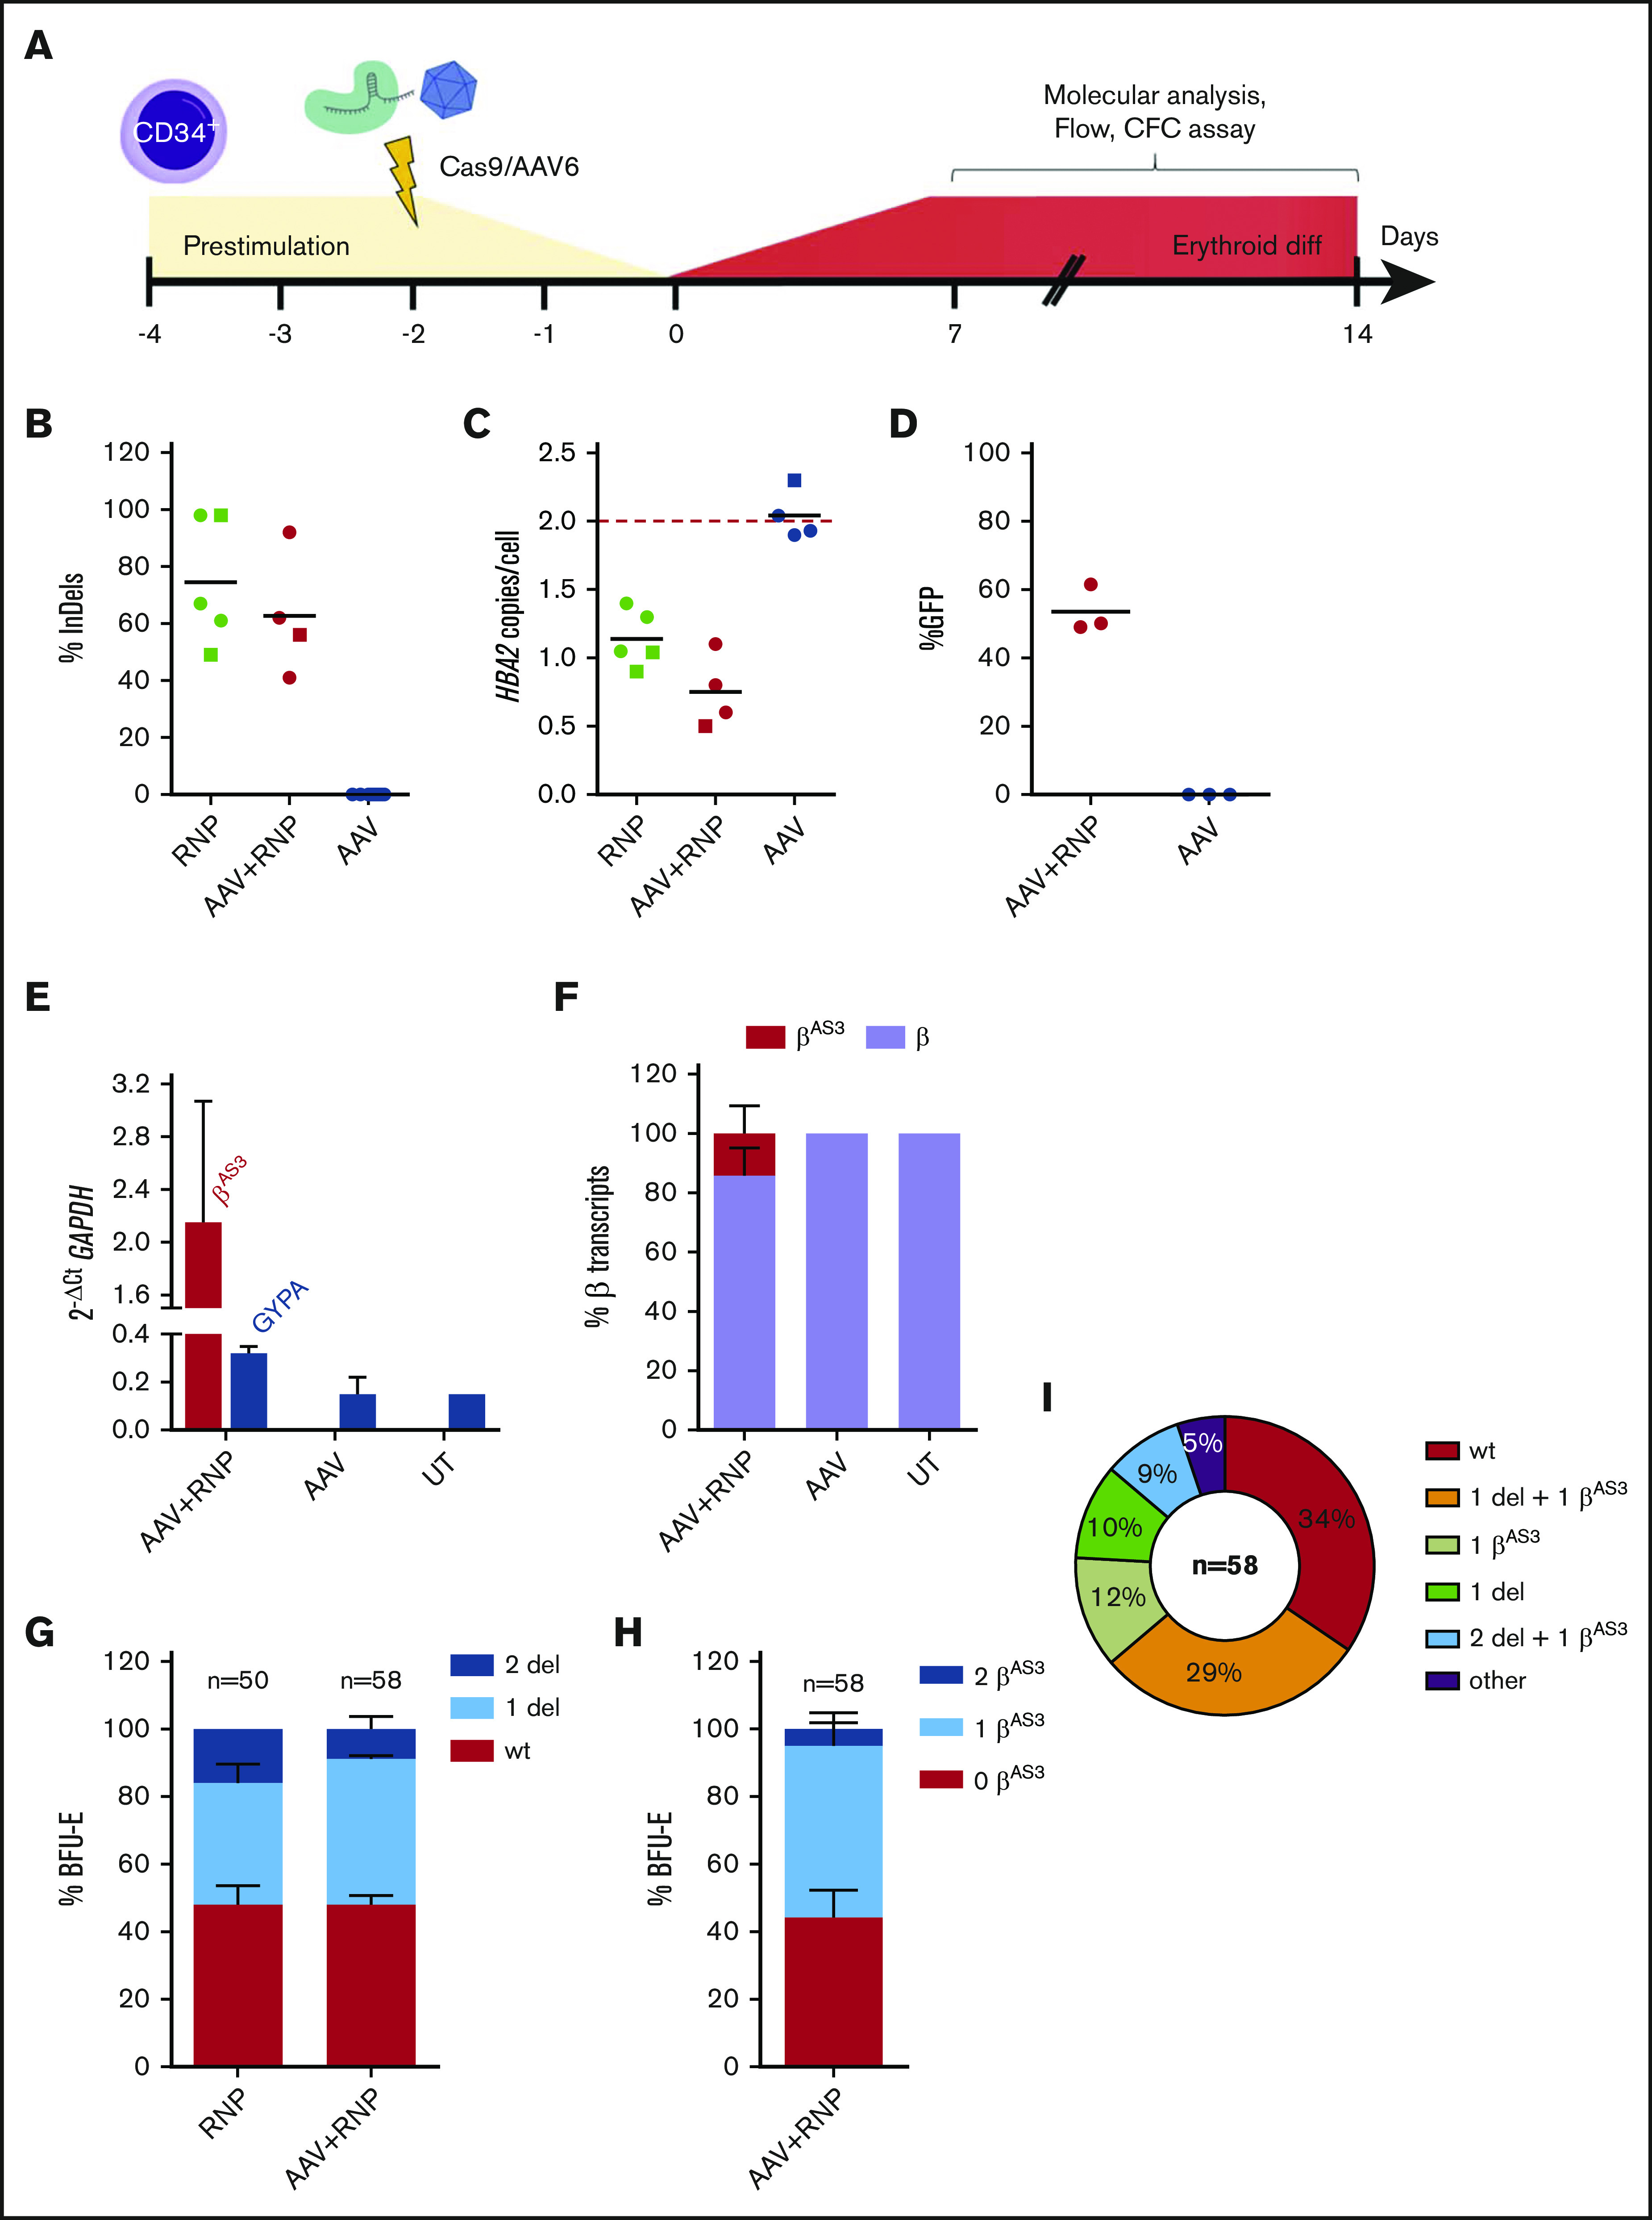
HBA2 deletion and βAS3integration efficiency in HSPCs. (A) Schematic representation of HSPC targeting experiments. (B) Editing efficiencies in HSPCs at day 12 of erythroid differentiation. Lines represent mean. HBA2 copies (C) and KI efficiency (D) in edited HSPCs in erythroid liquid culture (●) or in BFU-E (■). Black lines represent mean; red line indicates the number of expected HBA2 alleles in untreated HSPCs. (E) βAS3 and glycophorin A (GYPA) transcripts in HSPC-derived erythroblasts (qPCR, n = 2, mean ± SD). (F) Relative abundance of endogenous β and KI-βAS3 mRNA at day 12 of erythroid liquid culture (n = 6, mean ± SD). HBA2 deletion (G) and βAS3 integration (H) pattern in single BFU-E. Bars represent mean ± SD (colonies derived from 2 independent experiments); no integration (0), monoallelic (1), and biallelic (2) KI or deletion (del). (I) Genotypes distribution of single KI-βAS3 BFU-E. Percentages are indicated (n = 58).
