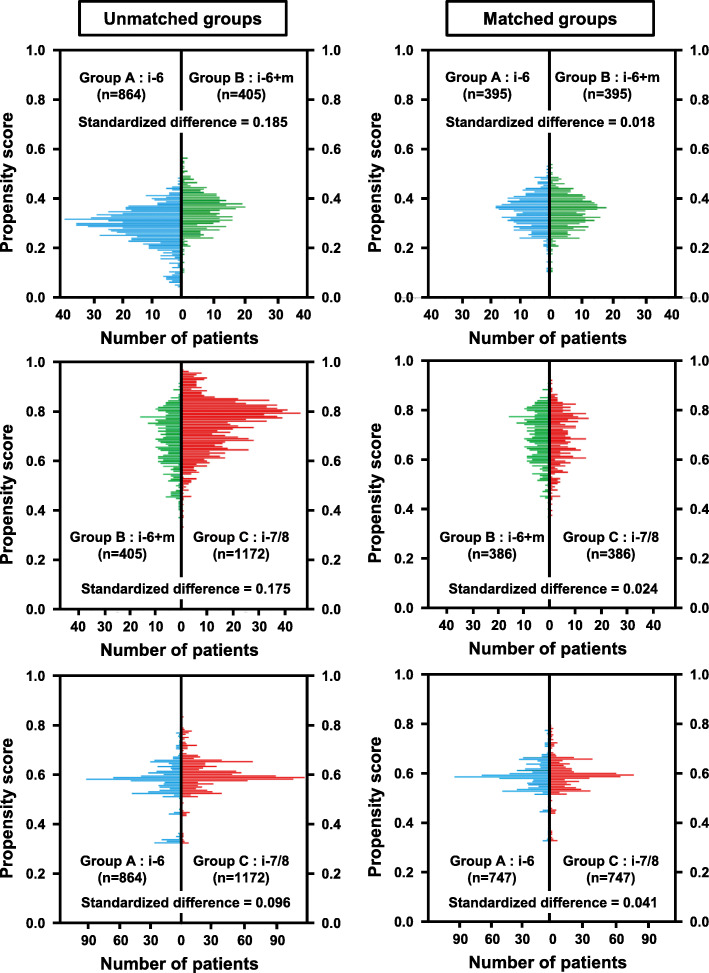
Fig. 3.
Distributions of propensity scores in the unmatched and matched groups. The propensity score was calculated for each patient using a multivariable logistic regression model based on the covariates shown in Table S2 (Additional file 3) and Table S3 (Additional file 4). Comparison of variables according to patterns of intravesical BCG treatment: after propensity score matching. One-to-one matching with a caliper width of 0.2 was applied to maintain a large sample size and balance between two groups: Group a vs. Group b (upper panels), Group b vs. Group c (middle panels), and Group a vs. Group c (lower panels)

