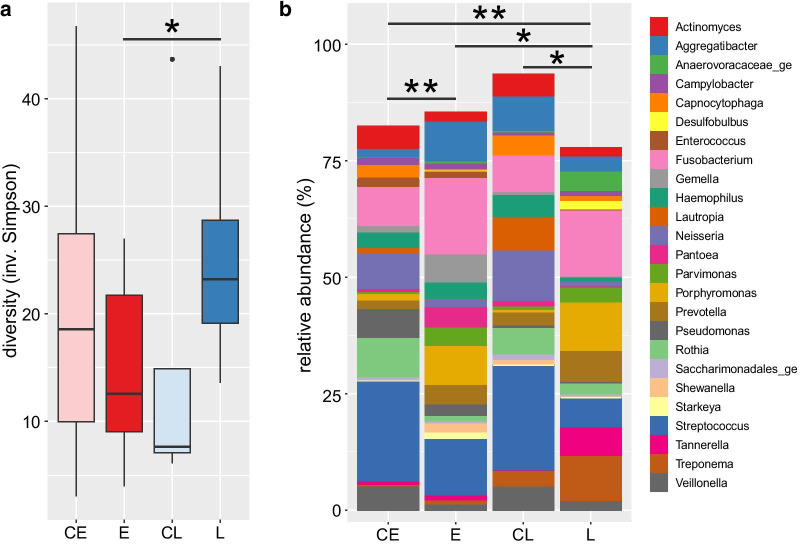
Fig. 2.
a Alpha-diversity of microbial composition in samples of implant groups. The groups of implants are labelled CE—early control, E—early implant loss, CL—late control, L—late implant loss. Diversity was calculated using the inverse Simpson index and is here depicted as box-and-whiskers-plots with the box representing values between the 1st and 3rd quartile, a black line indicating the median. b) Average relative abundance of the most abundant genera across implant groups. All sequence variants (ASVs) that were classified to belong to the same genus were aggregated. Horizontal lines indicate a significant difference in the microbiota composition between groups (pairwise Wilcoxon and pairwise PERMANOVA analysis in a, b, respectively). Asterisks in both panels indicate significance levels: *p < 0.05, **p < 0.01)

