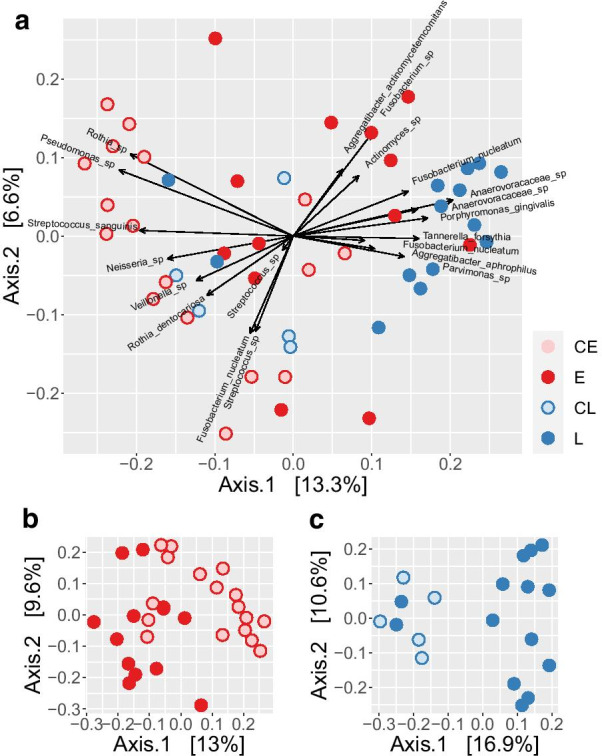
Fig. 3.

Principal coordinates analysis (PCoA) of relative abundances of ASVs across all samples. Individual samples are depicted as circles, colored by group of implants as labelled: CE—early control, E—early implant loss, CL—late control, L—late implant loss. a Biplot showing also arrows that represent the “loadings”, i.e. the contribution of the 20 most abundant sequence variants (ASVs) and are labelled with the species classification (if available). Axis.1 and Axis.2 represent the first two principal coordinates with the fraction of total variance explained by each coordinate written in square brackets. b, c PCoA plots of the early (E) and late (L) loss group of implants with their respective control groups
