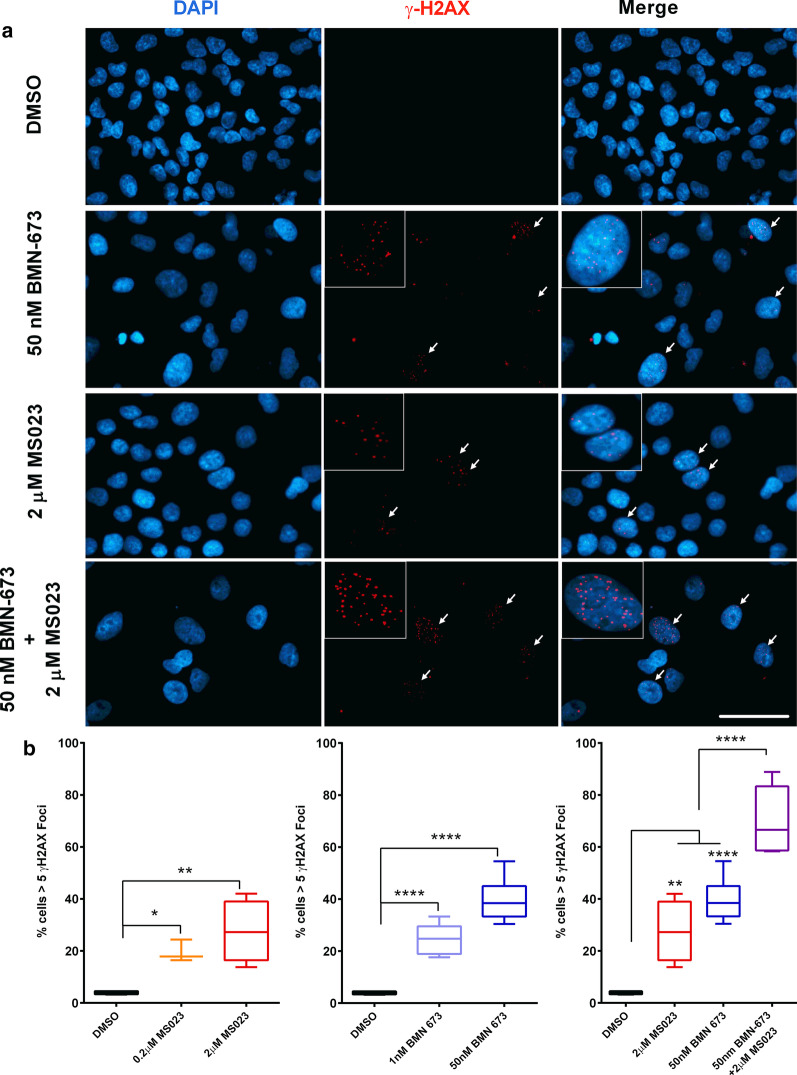
Fig. 6.
Accumulation of DNA double-strand breaks in A549 cells treated with MS023 and BMN-673. a Representative images of A549 cells treated with the indicated drug and concentrations for 7 days and stained for γ-H2AX. Scale bar represents 50 μm in all images. White arrows indicate cells with > 5 γ-H2AX foci. b Quantification of γ-H2AX foci in treated A549 cells. Box-and-whisker plots represent the percentage of cells with > 5 γ-H2AX foci, taken from a minimum total of 200 cells in each treatment group. ANOVA was used to compare treatment versus DMSO control, p values are presented within the graphs

