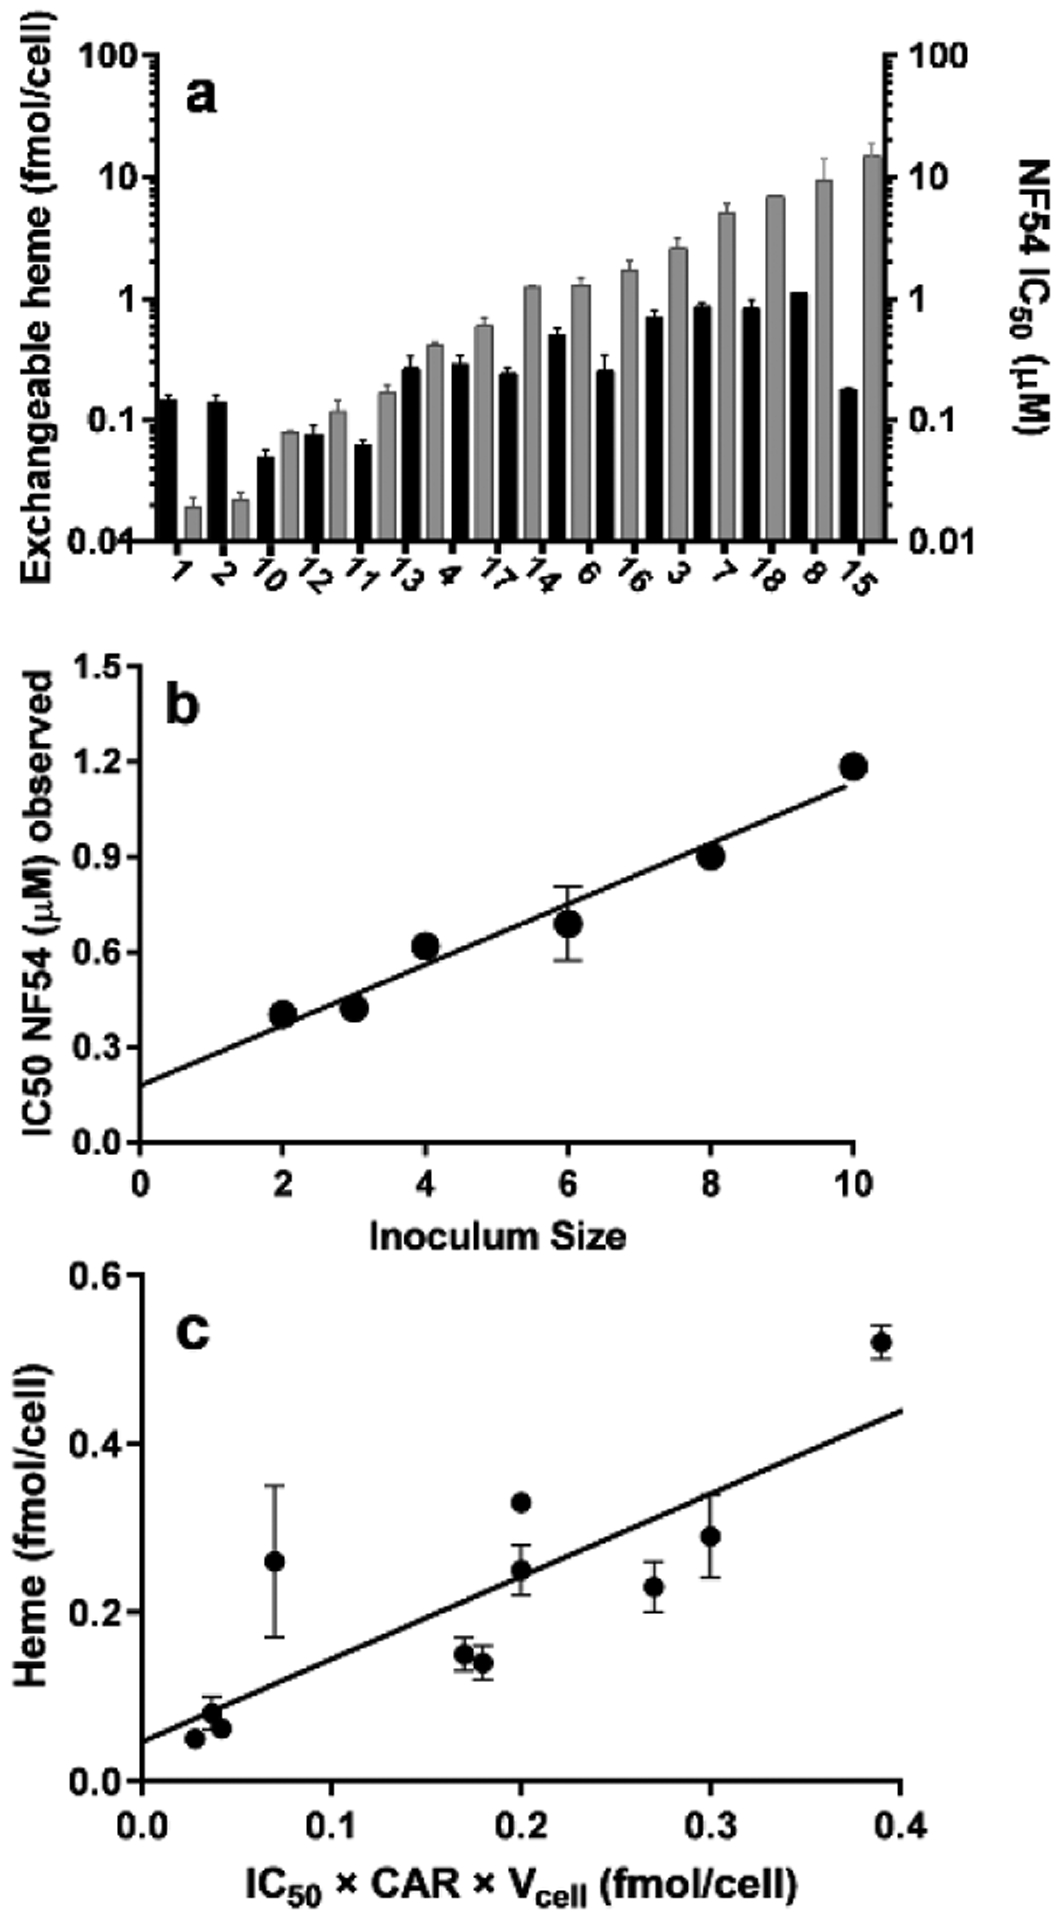
Figure 2.

Comparison of levels of exchangeable heme, parasite growth inhibition and compound accumulation in NF54 P. falciparum. (a) Exchangeable heme levels at the IC50 (black bars, left axis) and the corresponding IC50 values of each compound (grey bars, right axis) showing no direct correlation. Compounds are arranged in order of increasing IC50. (b) Inoculum effect for compound 13, r2 = 0.95. (c) A plot of exchangeable heme versus amount of intracellular test compound at the IC50. Slope 1.0 ± 0.2, intercept 0.05 ± 0.04, r2 = 0.70, P=0.0013, P value (runs test) = 0.61.
