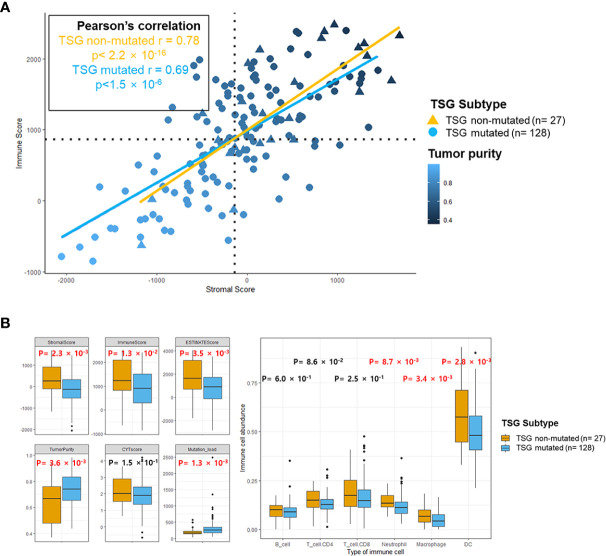
Figure 2.
The immune landscape of the microenvironment in TSG subtypes. (A) Scatterplots between stromal and immune scores with tumor purity gradient were shown, and its correlation coefficient was indicated by each of the subtypes. The color grading corresponds to the tumor purity, indexed as shown on the color bar at the bottom right of the panel. The median scores for stromal and immune scores were indicated by dashed lines under the horizontal (x) and vertical (y) axis. (B) Several indicators for immune response and abundance of infiltrating B cells, CD4+ T cells, CD8+ T cells, neutrophil, macrophages, and dendritic cells in two subtypes were estimated, and each p-value was indicated by each of the subtypes (Mann–Whitney U test and unpaired t-test). Box represents the median (thick line) and the quartiles (line).

