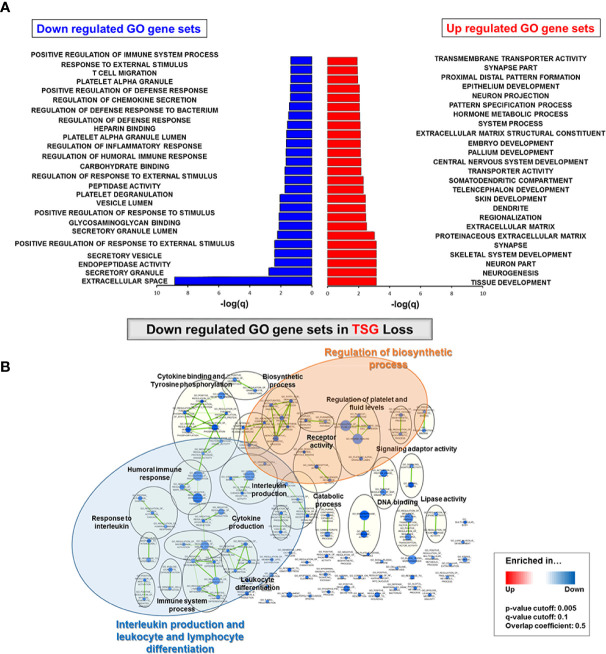
Figure 3.
Gene enrichment analysis in TSG subtypes. (A) Top 25 GO gene sets in either down- and up-regulated GO gene sets were determined based on the rank of enrichment –log10(q value) of the pathway and the matched significance criteria (P-value < 0.05 and FDR q value < 0.1) (B) Network visualization based on gene enrichment analysis. Blue nodes represent the down-regulated gene sets in TSG subtype. Genes in significant networks were annotated and grouped with simplified GO terms. Networks meeting the cut-off conditions detailed at the bottom of the figure (right) were visualized with the Enrichment Map plugin for Cytoscape (P ≤ 0.05, FDR q value ≤ 0.01, and similarity ≤ 0.5).

