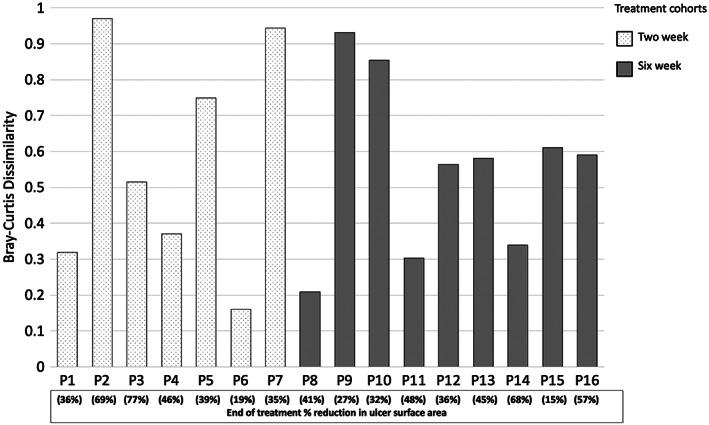
Figure 5.

Bray‐Curtis is a dissimilarity measure based on the difference in rank‐abundances of taxa between samples. The closer the metric reaches to number one, the more dissimilar the community structure. The closer to zero denotes the community structure is highly similar. Patients 1–7 represent the two‐week treatment cohort and patients 8–16 represent the six‐week treatment cohort
