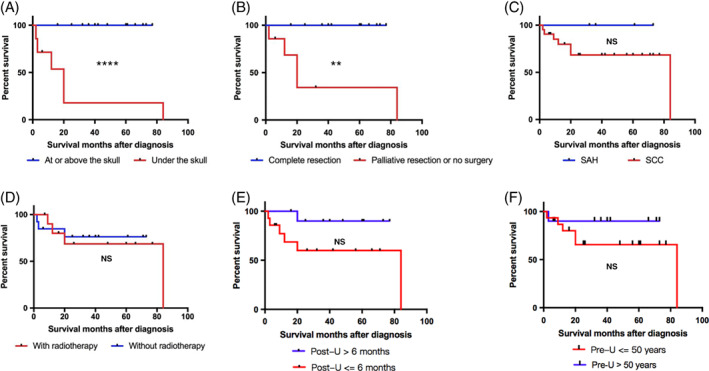
Figure 3.

Prognostic factors analysis. Survival curve of patients grouped by: A, Lesion infiltration depth. B, Tumour resection outcome. C, Pathological type. D, Radiotherapy. E, Post‐ulceration period. F, Latency periods. **P < 0.01; ****P < 0.0001; NS, P > 0.05
