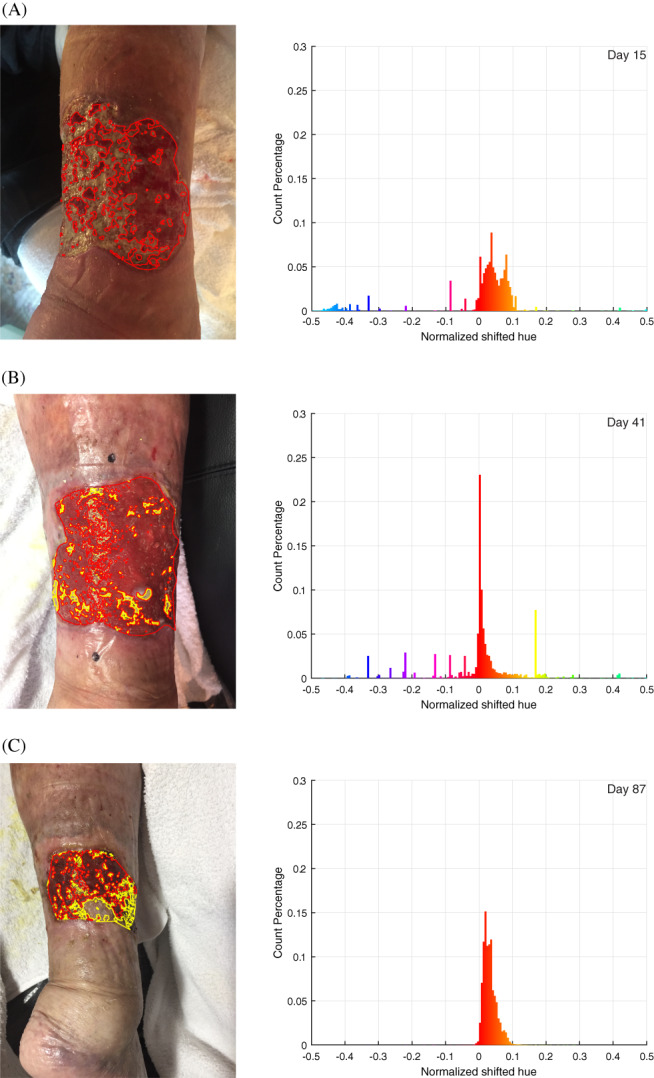
Figure 2.

Representative analysis performed on (A) day 15, (B) day 41, and (C) day 87. The three images presented are chosen to represent different stages in the treatment process and varying image lighting conditions. The left column shows the images taken with each classified area contoured (red: granulation, yellow: reepithelialised tissue). The right column shows the hue value histogram inside the wound area. Note the peak becomes significantly higher and narrower from day 15 to 41 because of the much‐increased percentage of granulation tissue, and the peak becomes slightly wider on day 87 because of the growing amount of epithelial tissue. The general trend is also visualised in Figure 5
