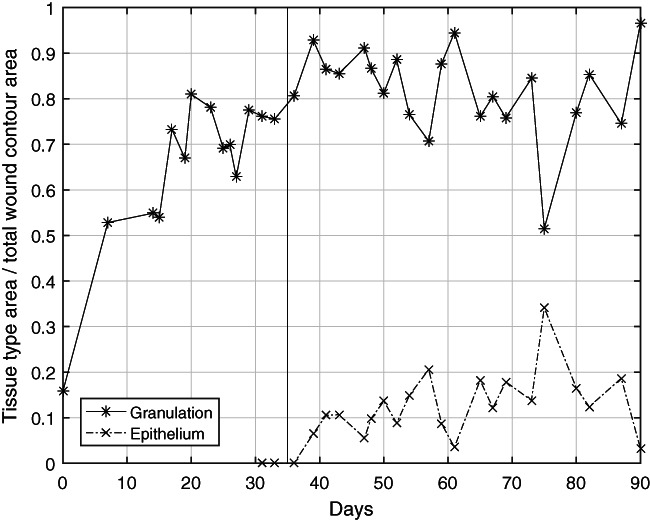
Figure 4.

Trend of wound healing as represented by the granulation and epithelial tissue. Measured statistic across multiple images on the same day is averaged. In the beginning, there was a rapid and steady trend of slough being replaced by granulation tissue as evident on the plot as the rise in granulation tissue percentage. Accounting for epithelial tissue started on approximately day 30 when significant epithelium growth started. With an initial rise of epithelium percentage around days 35 to 60, the level was steady afterwards. This plot provides different and complementary information to the wound size information in Figure 3. A limitation of the quantification of epithelium tissue inside the wound is that it does not adequately illustrate the reepithelialisation process outside the wound because it is no longer inside the wound area
