
FIGURE 1.
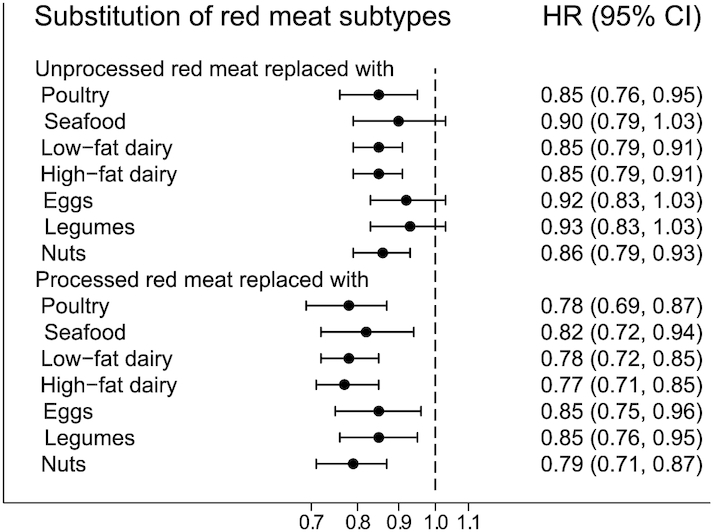
HR (95% CI) for type 2 diabetes mellitus associated with 1 daily serving decreased intake of unprocessed or processed red meat and concomitant increased intake of another major dietary protein source in pooled analyses of all 3 cohorts (n = 148,853). Note: the Cox proportional hazards models included all protein foods simultaneously and were adjusted for age, calendar time, and calories (initial and change, both quintiles), marital status (with spouse, yes or no), race (white, African American, Asian/other), family history of diabetes (yes, no), history of hypertension (yes, no), history of hypercholesterolemia (yes, no), BMI (<20.0, 20.0 to <23.0, 23.0 to <25.0, 25.0 to <30.0, ≥30.0 kg/m2) alcohol intake, both as initial intake (0, 0.1–4.9, 5–14.9, 15–29.9, ≥30 g/d) and change (quintiles), modified AHEI (initial and change, both quintiles), smoking status change (never to never, current to past, past to current, never to current, past to past, current to current), physical activity (metabolic equivalents initially and change, both quintiles) and for women initial menopausal status and use of postmenopausal hormones (premenopausal, postmenopausal + never hormone use, postmenopausal + past hormone use, postmenopausal + current hormone use), initial intake of red meat, poultry, seafood, low-fat dairy, high-fat dairy, eggs, legumes, and nuts (servings/d). For each substitution of 1 food item for another, we exponentiated the difference between the β-coefficients of the 2 foods to estimate the HR, and we used the variances and covariance of the 2 food items to estimate the 95% CI. The results across the 3 cohorts were pooled using an inverse variance weighted, fixed-effect meta-analysis. AHEI, Alternative Healthy Eating Index.