
FIGURE 3.
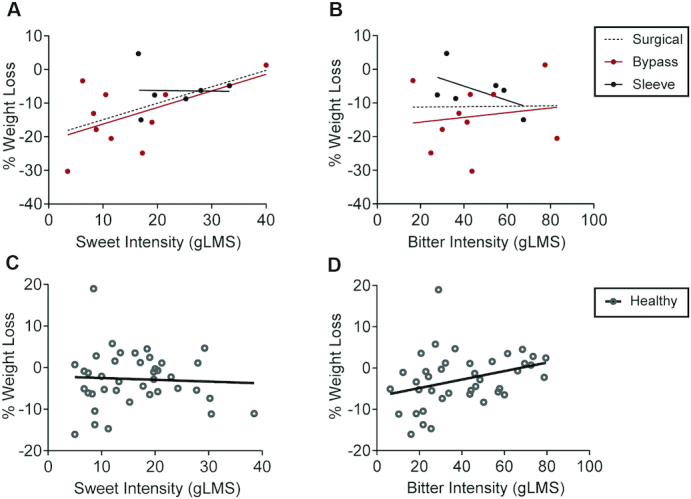
Associations between sweet intensity perception and %WL in a long-term follow-up bariatric cohort and comparison with healthy volunteers. (A) Correlations between sweet intensity perception and weight loss in the post–bariatric surgery cohort. The correlations between sweet intensity and %WL 4 years after the study baseline (2.5 years after surgery) were r = 0.5 (P = 0.04; n = 16) for the post–bariatric surgery group, r = 0.5 (P = 0.1; n = 10) for the GB group, and r = −0.02 (P = 1.0; n = 6) for the SG group. (B) Correlations between bitter intensity perception and weight loss in the post–bariatric surgery cohort. The correlations between bitter intensity and %WL 4 years after the study baseline (2.5 years after surgery) were r = 0.01 (P = 1.0; n = 16) for the post–bariatric surgery group, r = 0.2 (P = 0.7; n = 10) for the GB group, and r = −0.5 (P = 0.3; n = 6) for the SG group. (C) Correlation between sweet intensity perception and weight loss in healthy volunteers. The correlation between sweet intensity and %WL 5.6 years after the study baseline was r = −0.1 (P = 0.7; n = 40). (D) Correlation between bitter intensity perception and weight loss in healthy volunteers. The correlation between bitter intensity and %WL 5.6 years after the study baseline was r = 0.3 (P = 0.04; n = 40). Pearson correlation (r) was used to assess correlations between gustatory measures and %WL in healthy and surgical groups. %WL, percentage of weight loss; GB, gastric bypass; gLMS, general labeled magnitude scale; SG, sleeve gastrectomy.