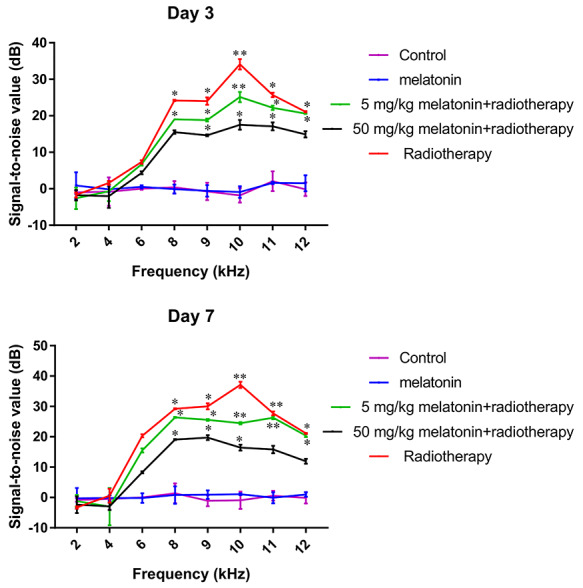
Fig. 5.

Difference of the average signal-to-noise ratio of DPOAE on day 3 (top) and day 7 (bottom) after irradiation in each group. The results show the mean ± standard deviation of three measurements. Difference = SNR before irradiation − SNR after irradiation. One-way ANOVA: *P < 0.05, **P < 0.01 when compared to the control group at the same time point.
