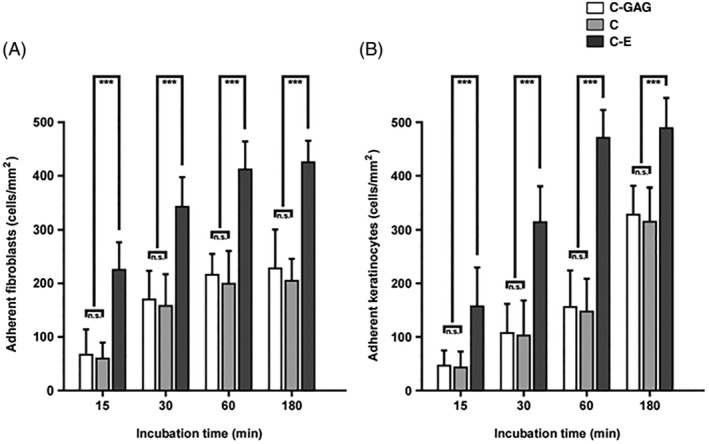
Figure 4.

Quantitative evaluation of initial fibroblast and keratinocyte adherence to different biomaterials. Biomaterial sections, mounted on microscopic slides, were incubated with fibroblasts (A) of keratinocytes (B). Adhered cells were identified and counted by electron microscopy as shown in Figure 3. In each case, about 500 randomly selected electron micrographs were evaluated. Staples are given as means med SD error bars from three different experiments. Statistical significances are expressed as n.s. (P ≥ .05); * (P ≤ .05); ** (P ≤ .01); *** (P ≤ .005)
