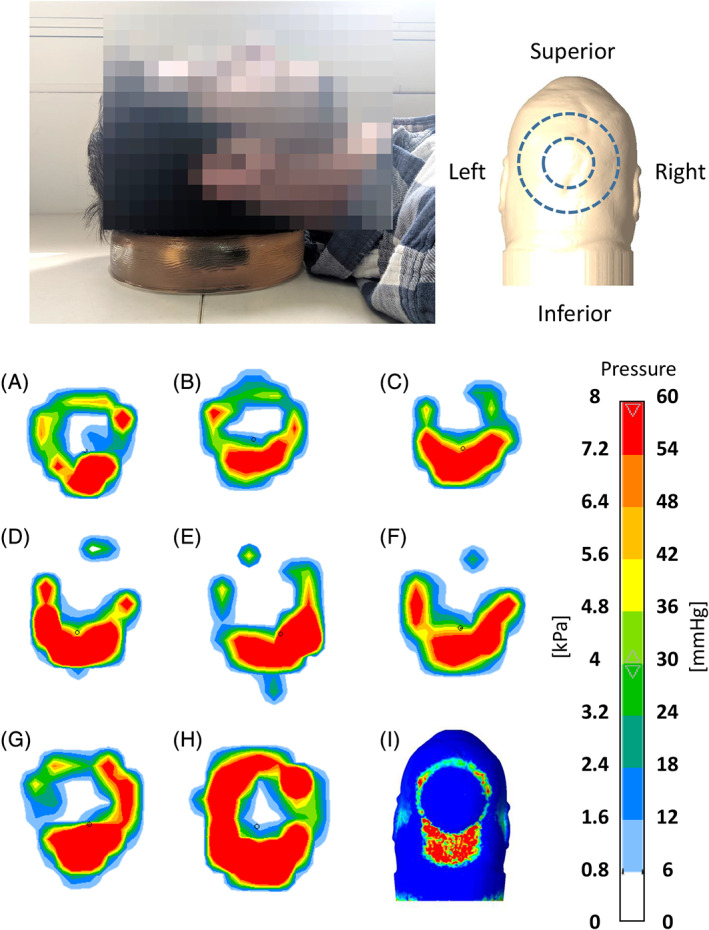
Figure 2.

Pressure maps measured under the rested head when positioned on a donut‐shaped gel head support (as shown in the photograph in the top frame and as further depicted in the top right panel) for eight different subjects (A‐H). The corresponding model‐predicted pressure distribution at the back of the head for the same configuration is shown in panel (I). Similarity to the empirical pressure maps, particularly concerning the highly loaded site at the inferior head/neck region, is evident. The orientations of the experimental and computational pressure maps are all as illustrated in the top right panel
