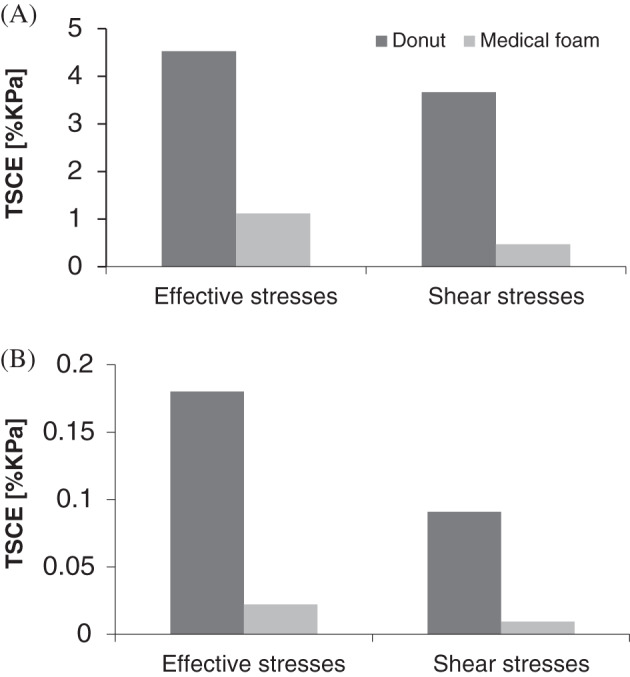
Figure 6.

Comparisons of total tissue stress concentration exposures (TSCE) derived from the histogram curves in Figure 5, per tissue type, that is, skin (A) or fat (B), and for each stress measure, that is, effective (left bars) or shear (right bars). The TSCE for a given tissue type in the scalp has been defined here as the area bounded between the corresponding stress curve in Figure 5 and the horizontal (stress) axis for the highest quartile of the calculated stress range (to focus on exposures to elevated or focal tissue stresses). All TSCE values were zero for the Z‐Flo head positioner (ie, for both skin and fat and for effective as well as shear stress data) [Correction added on6 January 2020, after first online publication: Figure 6 has been updated in this version.]
