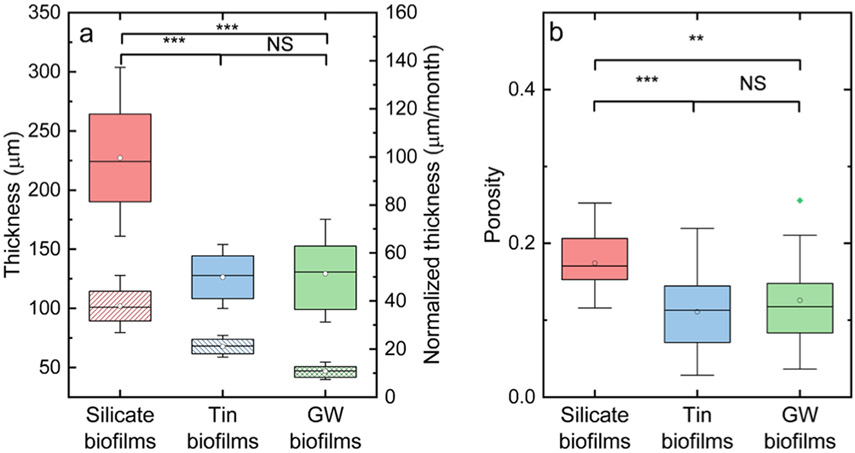
Figure 3.
(a) Thickness (solid) and normalized thickness (pattern) of silicate, tin, and groundwater biofilms. (b) Overall porosities of silicate, tin, and groundwater biofilms. The diamond dots indicate the means. The straight lines indicate the median, and the bounds of the colored boxes indicate 25–75th percentiles of the distributions. The asterisk indicates that there was a significant difference between two groups of data, as found with (a) the Wilcoxon rank-sum test and (b) KS hypothesis test. Two asterisks indicated a p-value less than 0.01 while three asterisks indicated a p-value less than 0.001. NS indicated that no significant difference was detected.

