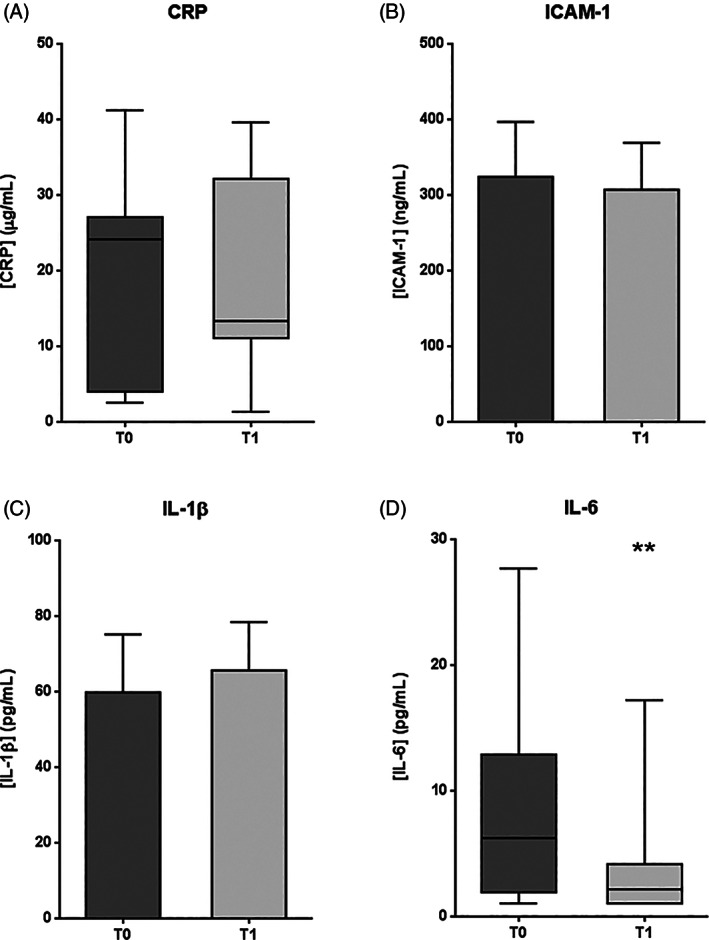
Figure 1.

Pro‐inflammatory marker levels in plasma samples from patients with DFU, before (T0) and after (T1) intralesional EGF treatment. A, C reactive protein (CRP). B, intercellular adhesion molecule 1 (ICAM‐1). C, Interleukin‐1β (IL‐1β). D, Interleukin‐6 (IL‐6). If data are in compliance with normal distribution, they are expressed as mean ± SD. Otherwise, they are represented as the median, 25th and 75th percentiles. Statistical analyses were performed using the Student's paired t test (data with normal distribution) or the Wilcoxon test (data without normal distribution). **P < .01
