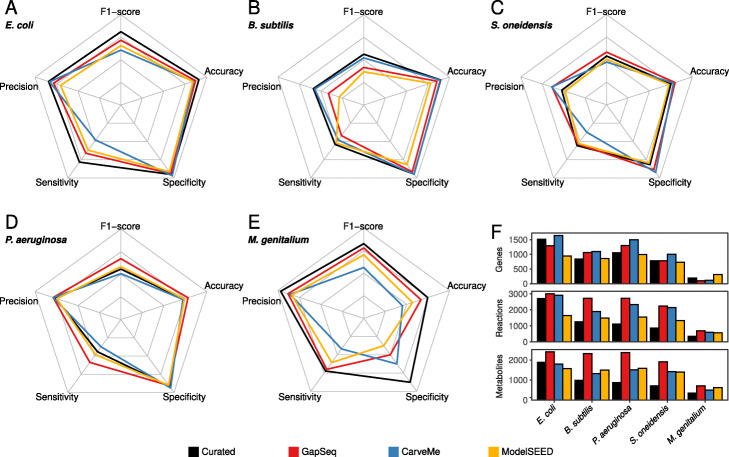
Fig. 2.
Results from model gene essentiality tests for five bacterial species. aEscherichia coli. bBacillus subtilis. cShewanella oneidensis. dPseudomonas aeruginosa. eMycoplasma genitalium. Results from gapseq models (red) are compared to CarveMe (blue) and ModelSEED (yellow) models, as well as to published curated genome-scale metabolic models (black) of the respective organisms. Radar chart axes scales are linear with 0 in the centre and 1 at the corners. f Counts of genes, reactions (including exchanges and transporters), and metabolites in each reconstruction

