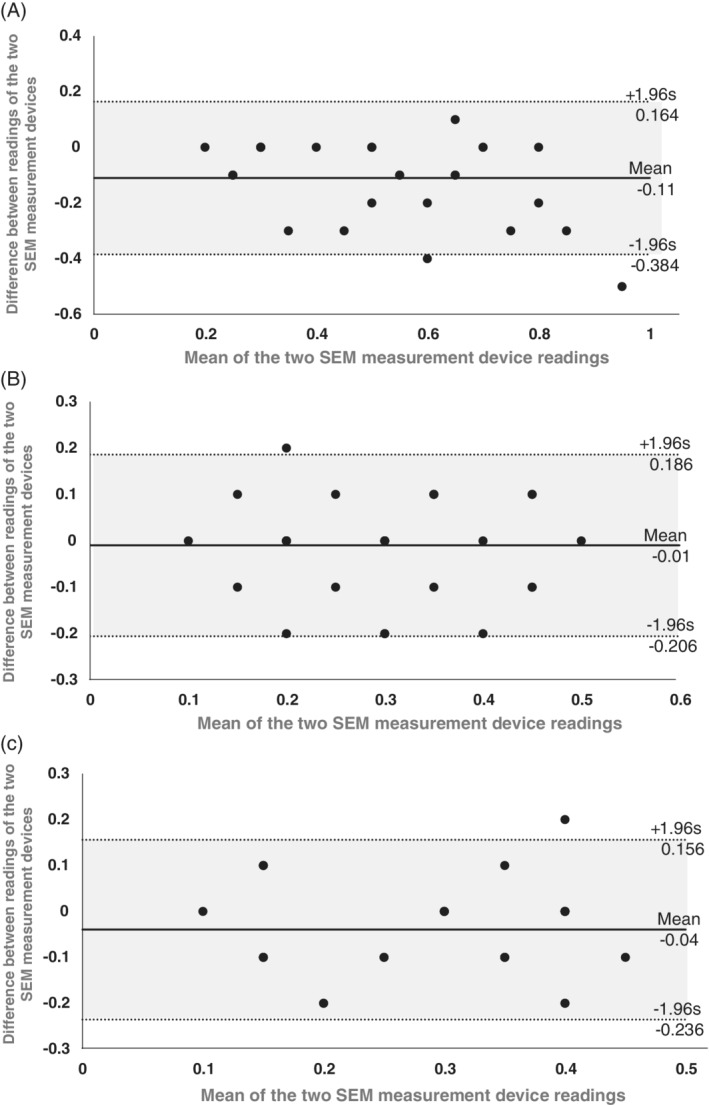
Figure 2.

Bland‐Altman (mean difference) plots for the heel phantom A, and for the skull/face phantom at the left cheek B, and chin C,. These plots show the differences between the readings of a second‐generation design of a sub‐epidermal moisture (SEM) measurement device (SEM‐2) and corresponding readings of the first‐generation device (SEM‐1) (on the y‐axis) against the mean of the two device readings (x‐axis). The mean difference between the SEM‐2 and SEM‐1 device readings is depicted by a solid line, and the 95% confidence interval on the mean difference is marked by dotted lines
