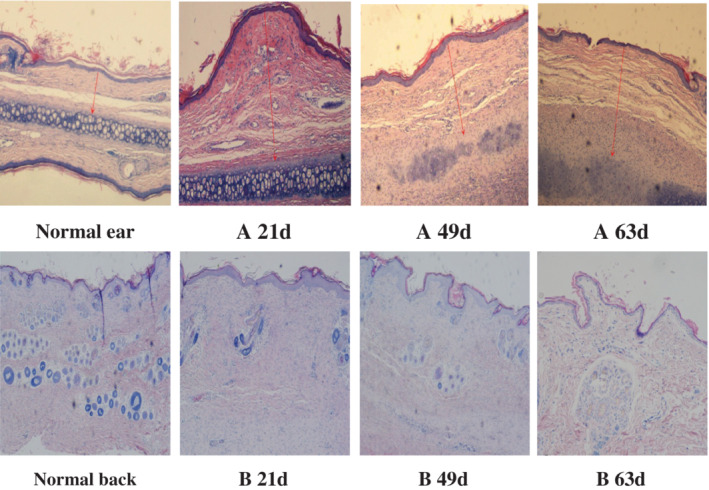
Figure 4.

Comparison of two microstructures of scar tissue at different time points (×40‐fold) (A: HS group; B: NS group) (red arrow in the figure is the vertical distance from the highest point of scar marked to the cartilage surface when measuring scar elevation index [SEI])
