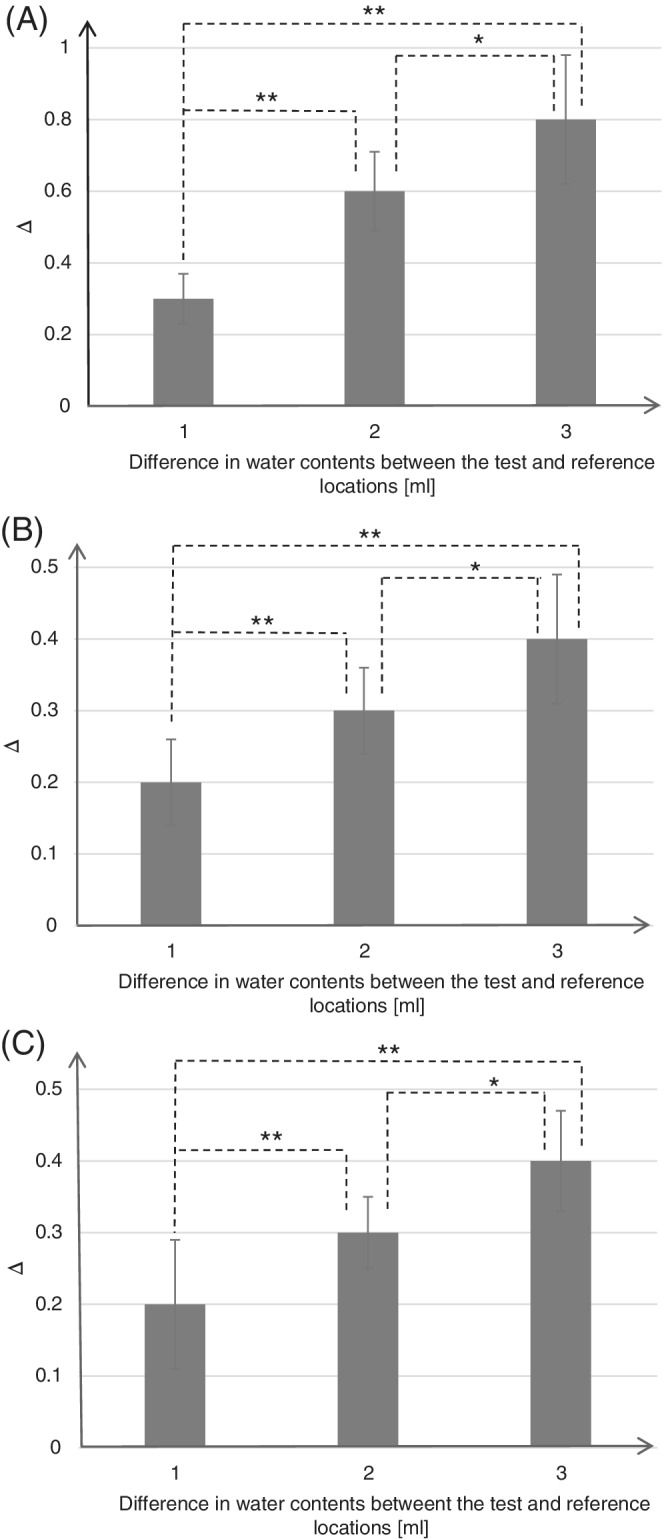
Figure 4.

Means and SDs of sub‐epidermal moisture (SEM) delta values, calculated as a difference between SEM readings at the reference sample (loaded with 1 mL water) and test sample (loaded with 2, 3 or 4 mL water) for the heel phantom (A) and for the skull/face phantom at the left cheek (B) and the chin (C). The statistically significant differences marked on the bar graphs were *P < .003 and **P < .00001 for the heel phantom (A), and *P < .02 and **P < .0003 for the skull/face phantom (B, C)
