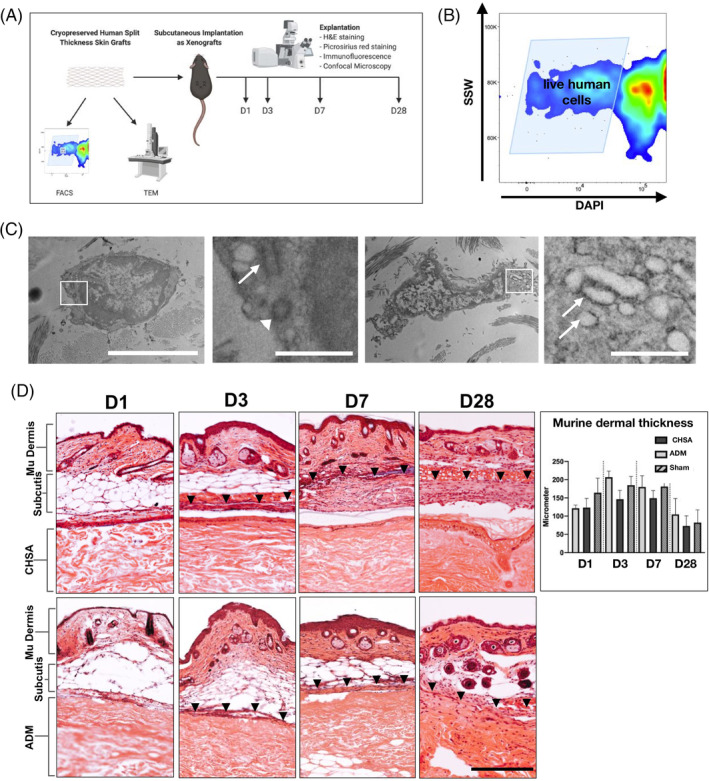
Figure 1.

A, Schematic of the experiments performed to establish the xenograft model (created with biorender.com). Cryopreserved human skin allografts (CHSA) were analysed by flow cytometry (FACS) and transmission electron microscopy (TEM). in vivo implantation of CHSA and an acellular dermal matrix (ADM) was performed subcutaneously into C57BL6/J mice. Explantation was performed on days 1, 3, 7, and 28 for H&E and picrosirius red staining as well as immunofluorescent staining and confocal microscopy. B, Single cell suspensions derived from thawed CHSA were subjected to FACS, showing numerous live (DAPI‐negative) cells. SSW, side scatter width. C, TEM revealed live cells with intact cell and nuclear membranes and functional organelles such as centrioles (second panel: arrow pointing to longitudinal section, arrowhead pointing to cross section) and rough endoplasmatic reticulum (fourth panel, arrows). White squares indicate the areas of the magnified images. Scale bars: 5 μm in overviews and 1 μm in magnified images. D, H&E images of explanted xenografts with overlaying murine (mu) subcutis and skin on days (d) 1, 3, 7, and 28. Arrowheads indicate the upper border of the fibrous capsule forming around the xenografts. Scale bar: 200 μm. H&E, haematoxylin and eosin
