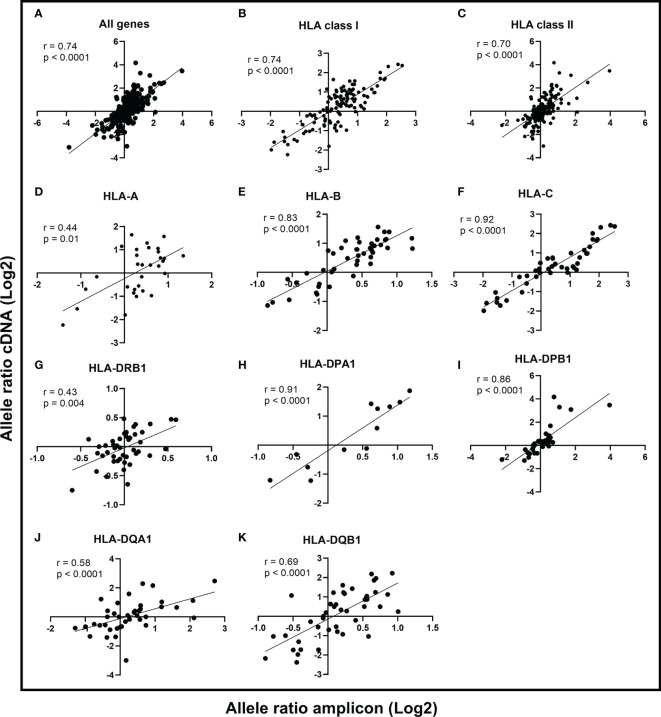
Figure 2.
Comparison of allele ratios between Illumina cDNA and Illumina amplicon datasets. The allele expression ratio was calculated for each heterozygous allele pair in the two datasets and a non-parametric Spearman’s rank correlation was used to compare the allele-level expression between cDNA and amplicon data. The line indicates the linear regression. The Spearman correlation coefficient is given for all genes (A), HLA class I (B), HLA class II (C), and for genes HLA-A (D), HLA-B (E), HLA-C (F), HLA-DRB1 (G), HLA-DPA1 (H), HLA-DPB1 (I), HLA-DQA1 (J), and HLA-DQB1 (K).

