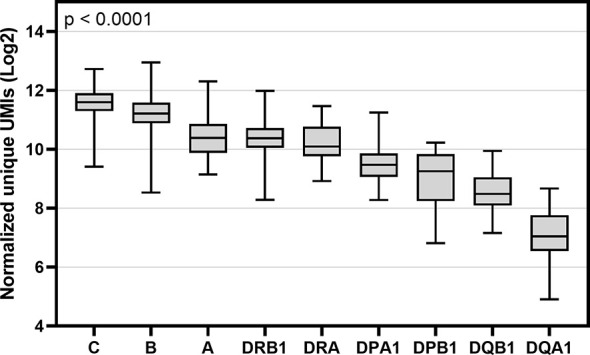
Figure 3.

Box and whisker plot of gene-specific expression of nine HLA genes of 50 individuals. Y-axis indicates the sum of normalized unique UMIs (Log2) of two alleles of cDNA data and X-axis indicates the names of nine HLA genes. Boxes indicate the lower quartile, median and upper quartile. Data were compared using a Kruskal-Wallis test.
