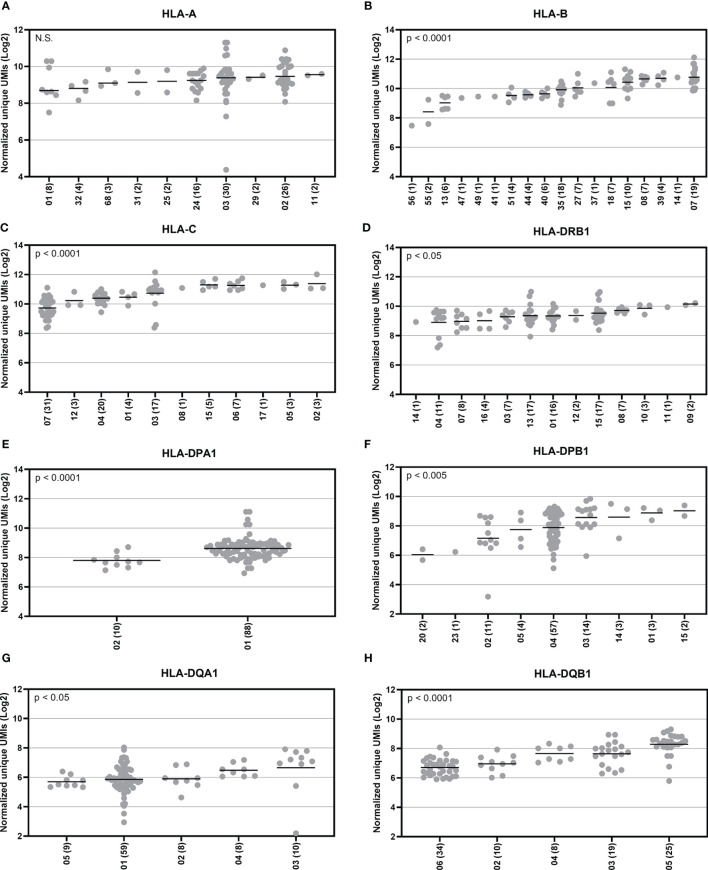
Figure 4.
Allotype expression of HLA class I and class II genes of 50 individuals. Allele-level UMIs of eight HLA genes (A–H) were normalized, grouped to allelic lineages, and plotted according to different lineages in Illumina cDNA data. Y-axis indicates the normalized unique UMIs (Log2) and X-axis indicates the names of the allelic lineages. Each dot refers to a UMI value and a solid bar indicates the median expression of the lineage. The number of samples are shown within parentheses. A Kruskal-Wallis test compared the ranks between the allelic lineages.

