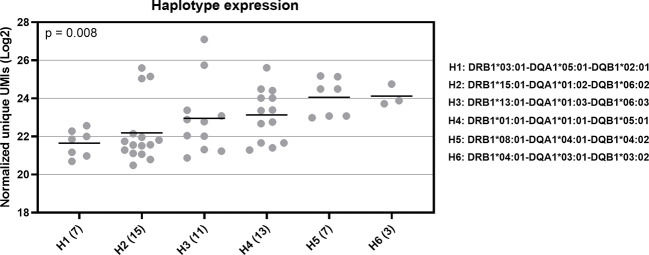
Figure 6.
RNA expression of six common HLA haplotypes in Finnish population. Y-axis indicates the normalized UMIs (Log2) of cDNA data and X-axis indicates the codes of the five selected HLA haplotypes. The full haplotype names are marked on right side of the figure. The parenthesis following the haplotype codes indicate the number of the samples for each haplotype. Each dot refers to a UMI value and a solid bar indicates the median expression of the haplotype. Data were compared using a Kruskal-Wallis test.

