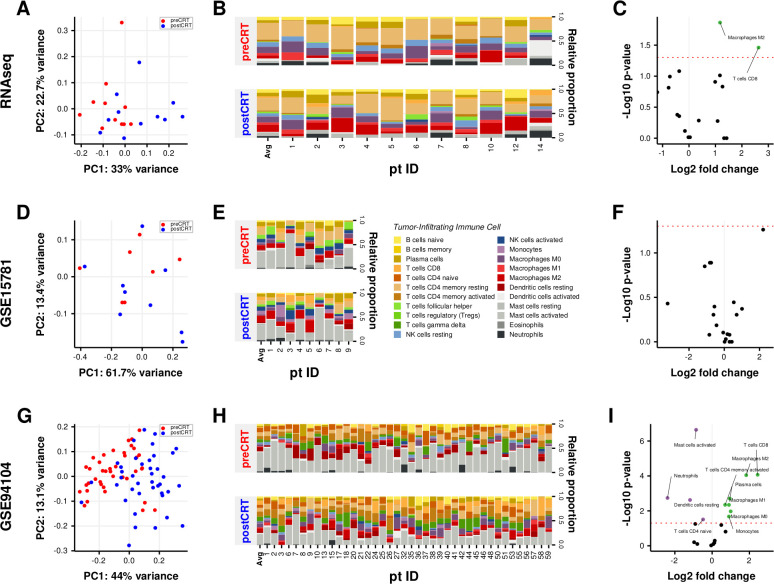
Figure 5.
Comparison of tumor-infiltrating immune cell fractions in LARC tissues before and after CRT. (A) PCA of TIIC fractions from each sample before and after CRT. The first two principal components explaining most of the data variation are shown. (B) Differences in TIICs between paired LARC tissues before and after CRT. (C) Volcano plot visualizing the differential TIICs. The green and purple points in the plot represent subpopulations with significant differences (p<0.05). CRT, chemoradiation therapy; LARC, locally advanced rectal cancer; PCA, principal component analysis; RNAseq, RNA sequencing; TIICs, tumor-infiltrating immune cells.

