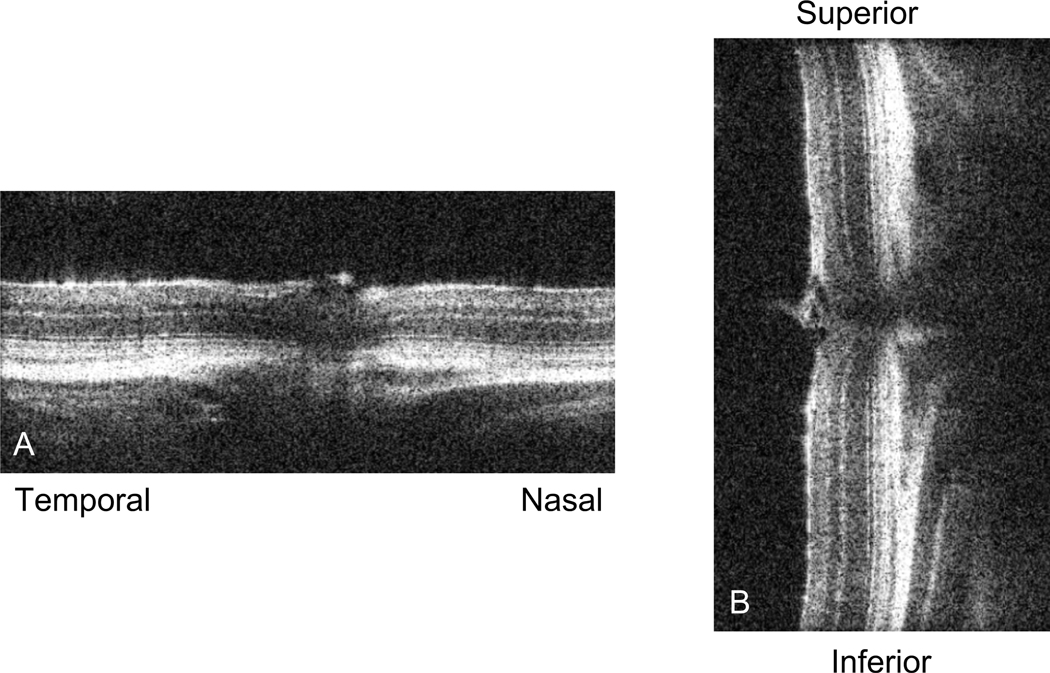
Figure 2: SD-OCT sample scan.
Picture of a live scan of the mouse retina just prior to taking a volume or radial scan. (A) depicts the nasal-temporal alignment, while (B) shows the superior-inferior alignment. Once the retinas in these two images are straight in their respective vertical or horizontal planes and the optic nerve is centered in both images, we proceed to acquire the SD-OCT image.

