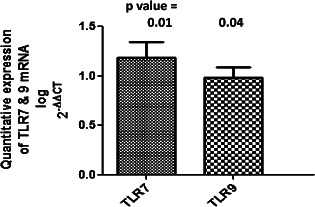
Figure 1.

Bar graph of quantitative real‐time polymerase chain reaction (RT‐PCR) analysis showing the higher expression of mRNA of TLR7 and TLR9 in the wounds of 84 diabetic foot ulcer (DFU) patients compared with 6 controls. Fold change in the expression of genes was determined using the ΔΔCT method of relative quantification. Firstly, normalisation of the resulting threshold cycle (CT) values of the target gene was performed with the CT values of the internal control GAPDH in the same samples (ΔCT = CT target − CT GAPDH). It was again normalised with the control (ΔΔCT = ΔCT − ΔCT control). The fold change in the expression was then calculated (2−ΔΔCT). The graph was plotted using log 2−ΔΔCT. The graph clearly show that TLR9 and TLR7 were up‐regulated significantly in the wounds of type 2 diabetes mellitus (T2DM) cases (P value = 0·04, mean log of fold change = 0·98, standard error of mean = 0·11 for TLR9 and P value = 0·01, mean log of fold change = 1·18, standard error of mean = 0·16 for TLR7). [Log (fold change 10) = 1].
