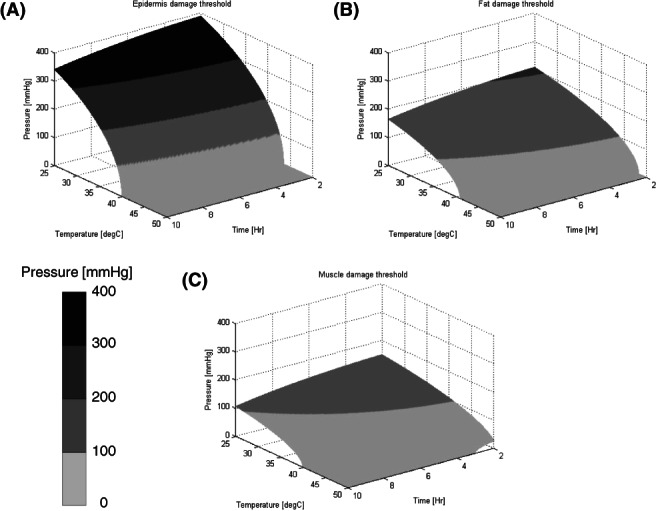
Figure 3.

Damage score threshold 3D plots for (A) Epidermis, (B) Fat, and (C) Muscle tissue, caused by applied pressure and temperature for varying durations, reconstructed using the equations developed by Kokate et al.28 The plotted surface represents a unity damage score, a value that was determined by the original authors as the damage threshold
