
Figure 3.
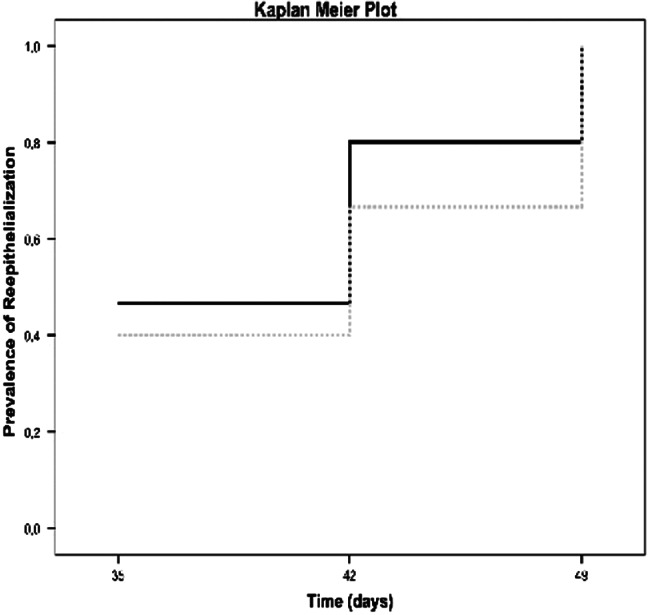
Kaplan Meier plot of prevalence of reepithelialisation. Black line represents Nevelia group, grey line Integra group. No statistically significant differences between the 2 groups at healing time, 49 days (P = .467, log‐rank test)
Official websites use .gov
A
.gov website belongs to an official
government organization in the United States.
Secure .gov websites use HTTPS
A lock (
) or https:// means you've safely
connected to the .gov website. Share sensitive
information only on official, secure websites.
Kaplan Meier plot of prevalence of reepithelialisation. Black line represents Nevelia group, grey line Integra group. No statistically significant differences between the 2 groups at healing time, 49 days (P = .467, log‐rank test)